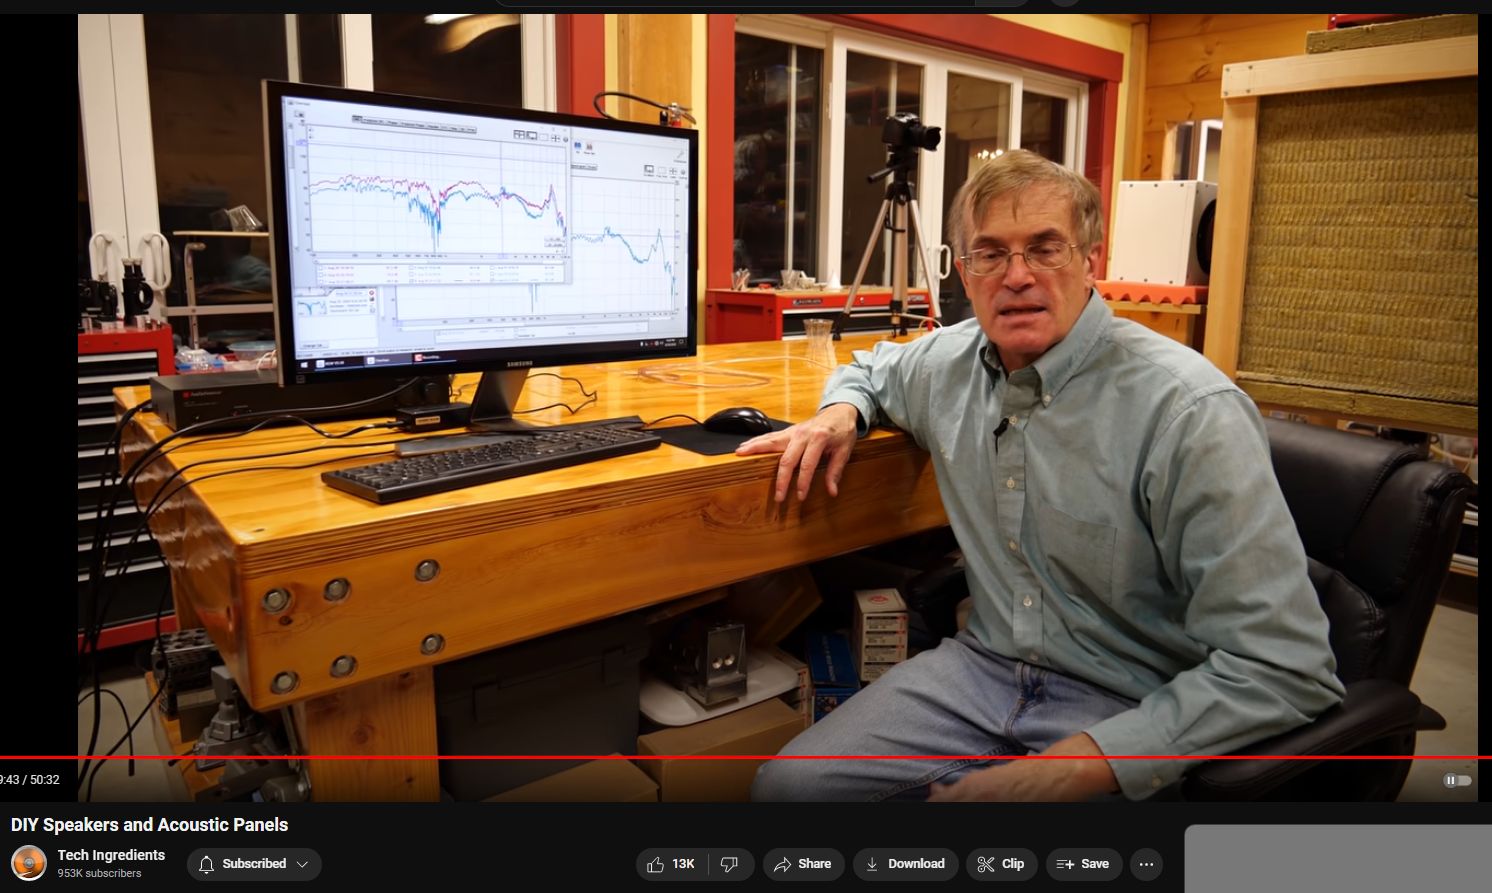
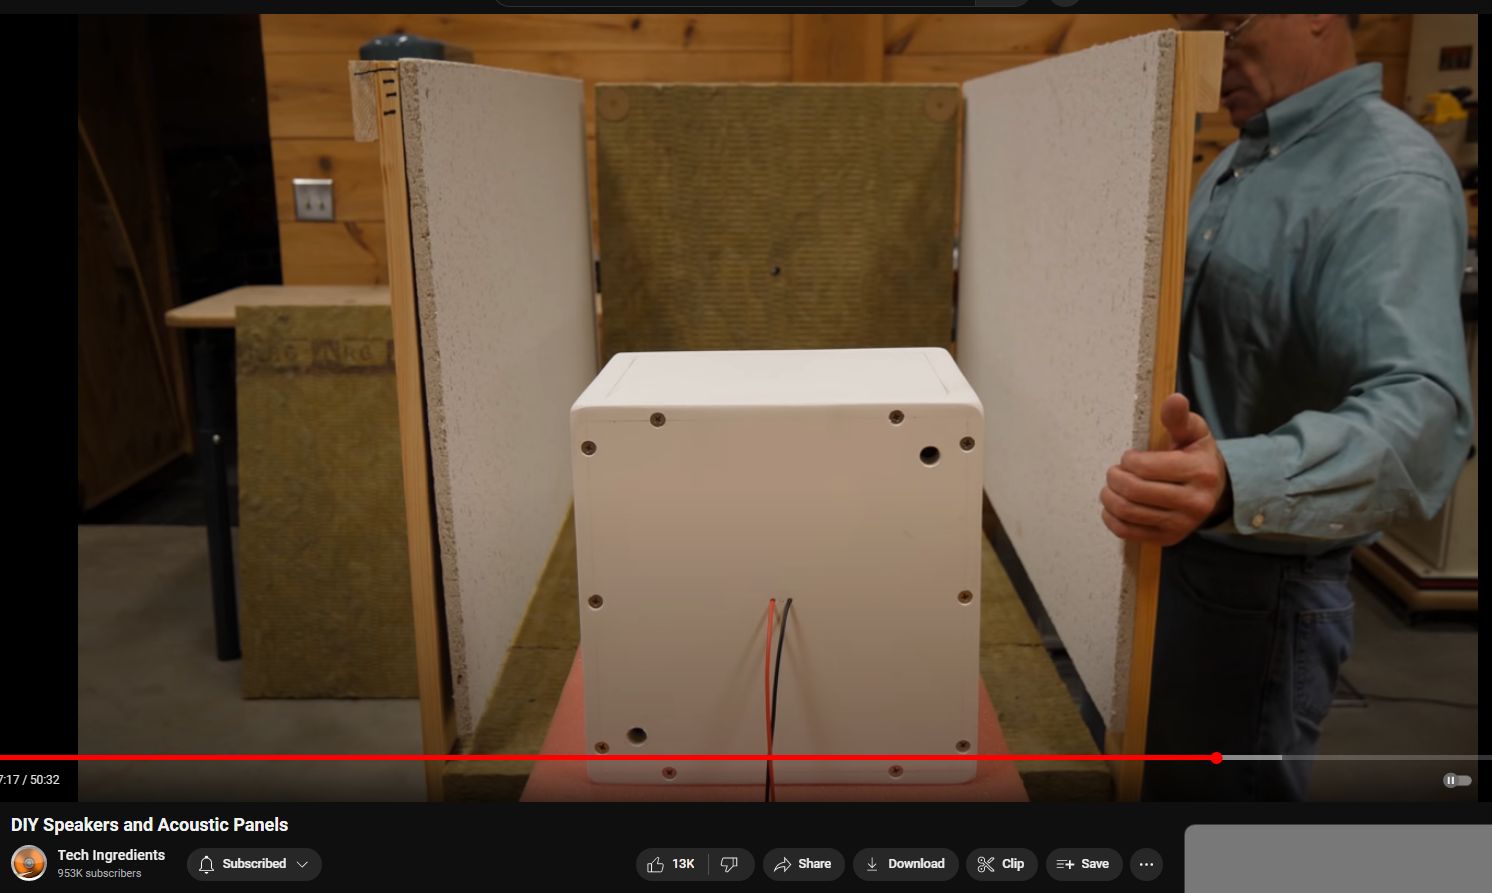
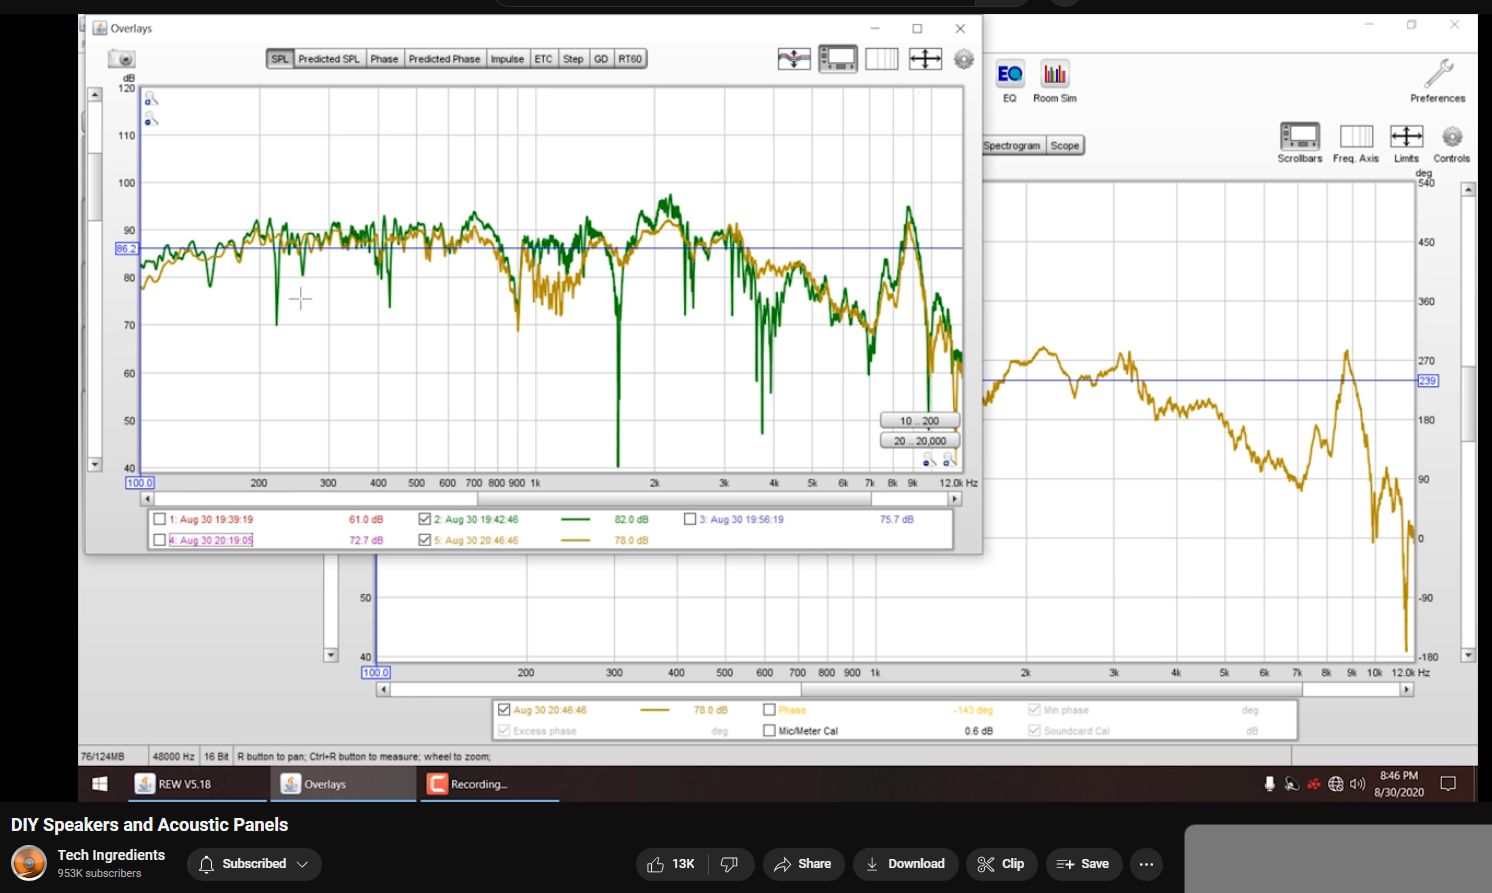
Measuring DIY Speakers
Helium gas inside enclosure. Overall +2dB gain as speaker back-pressure is reduced.
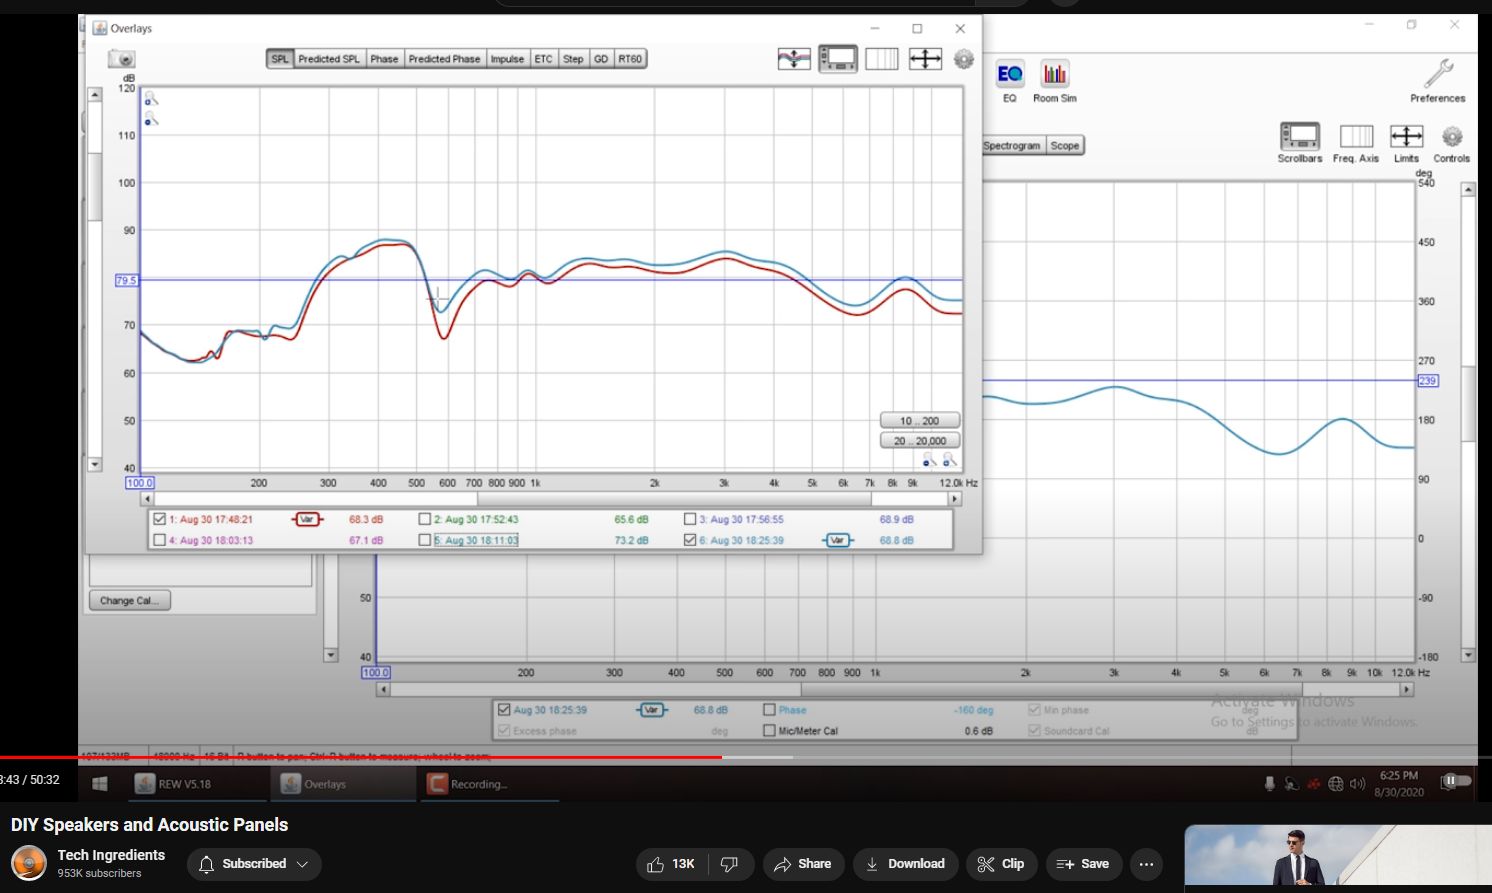
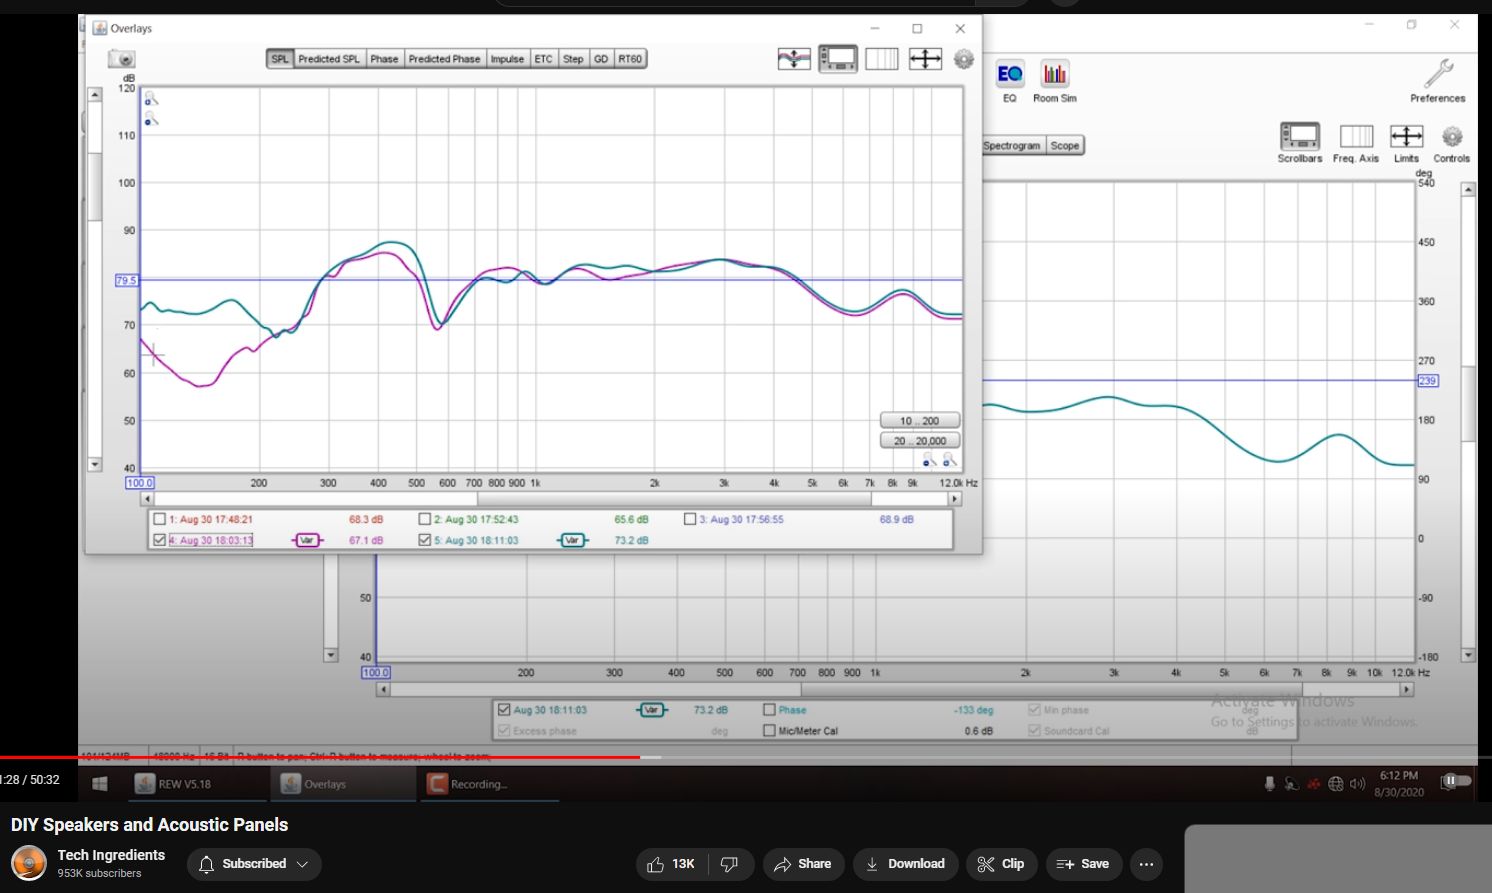
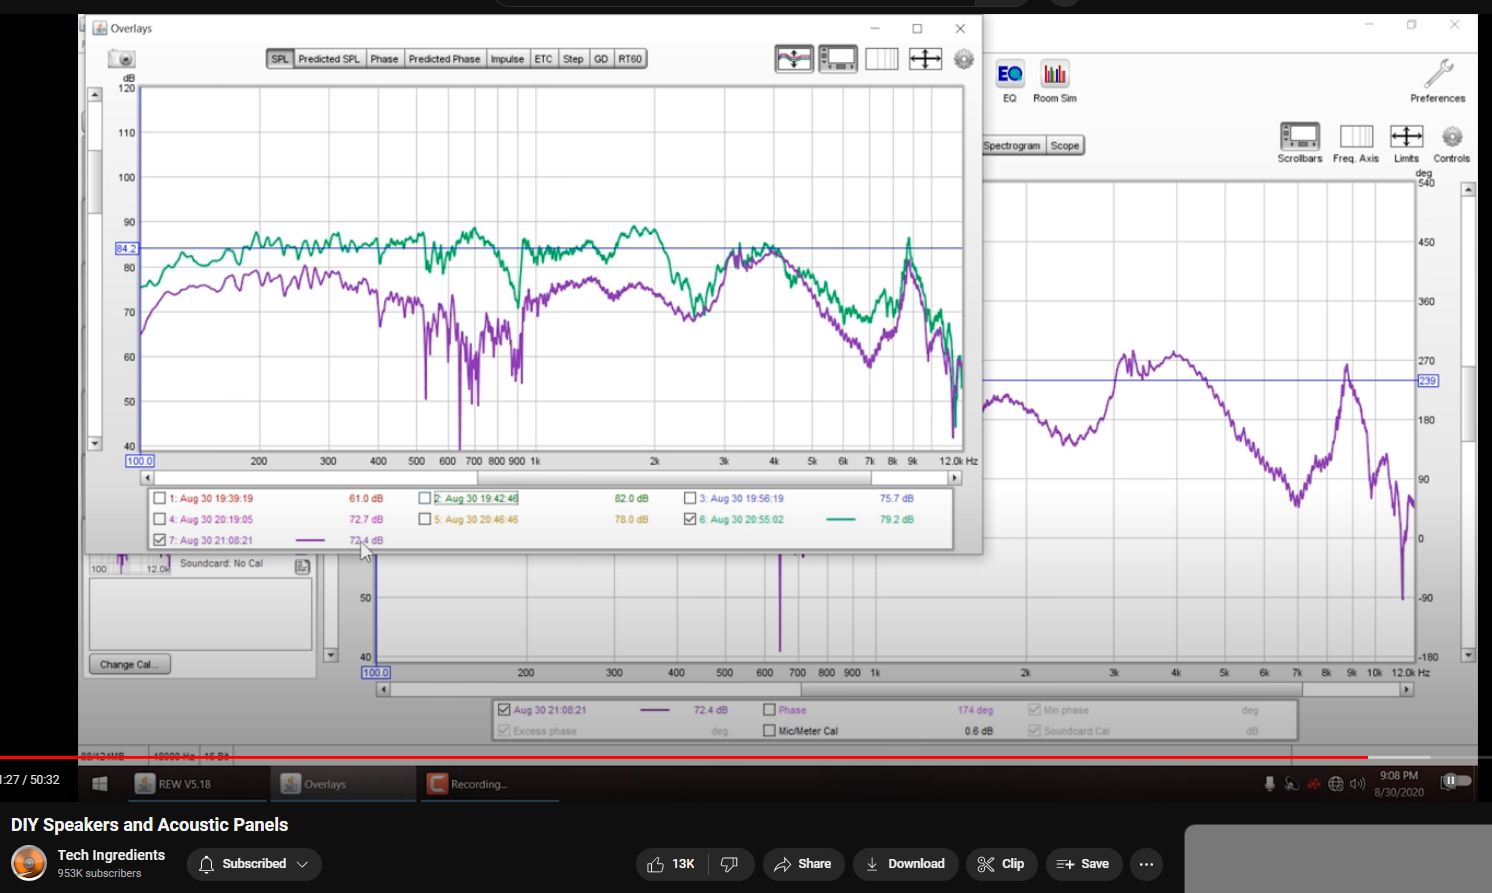
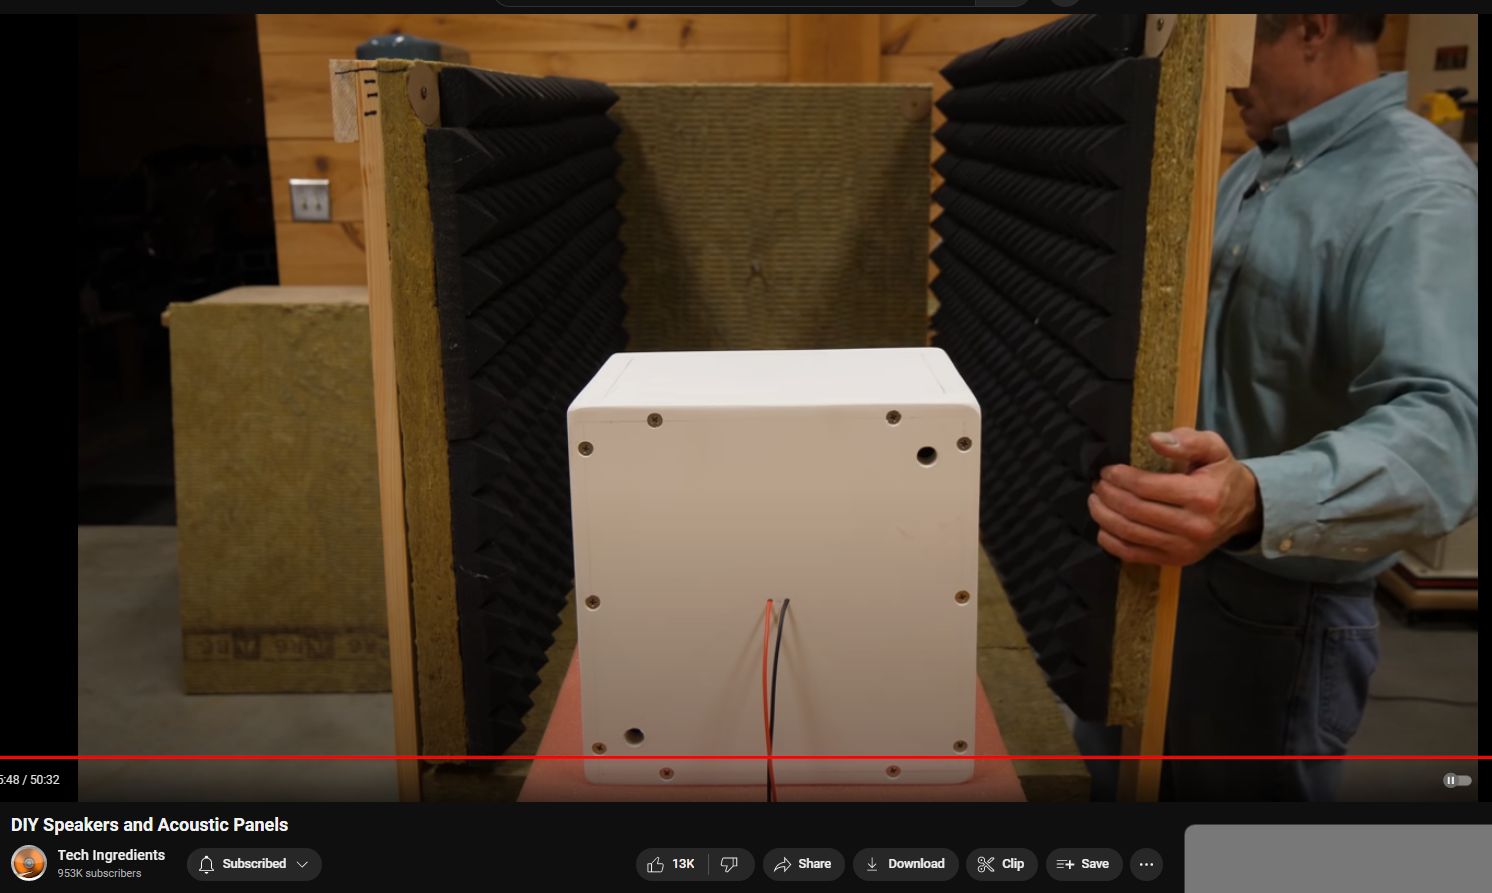
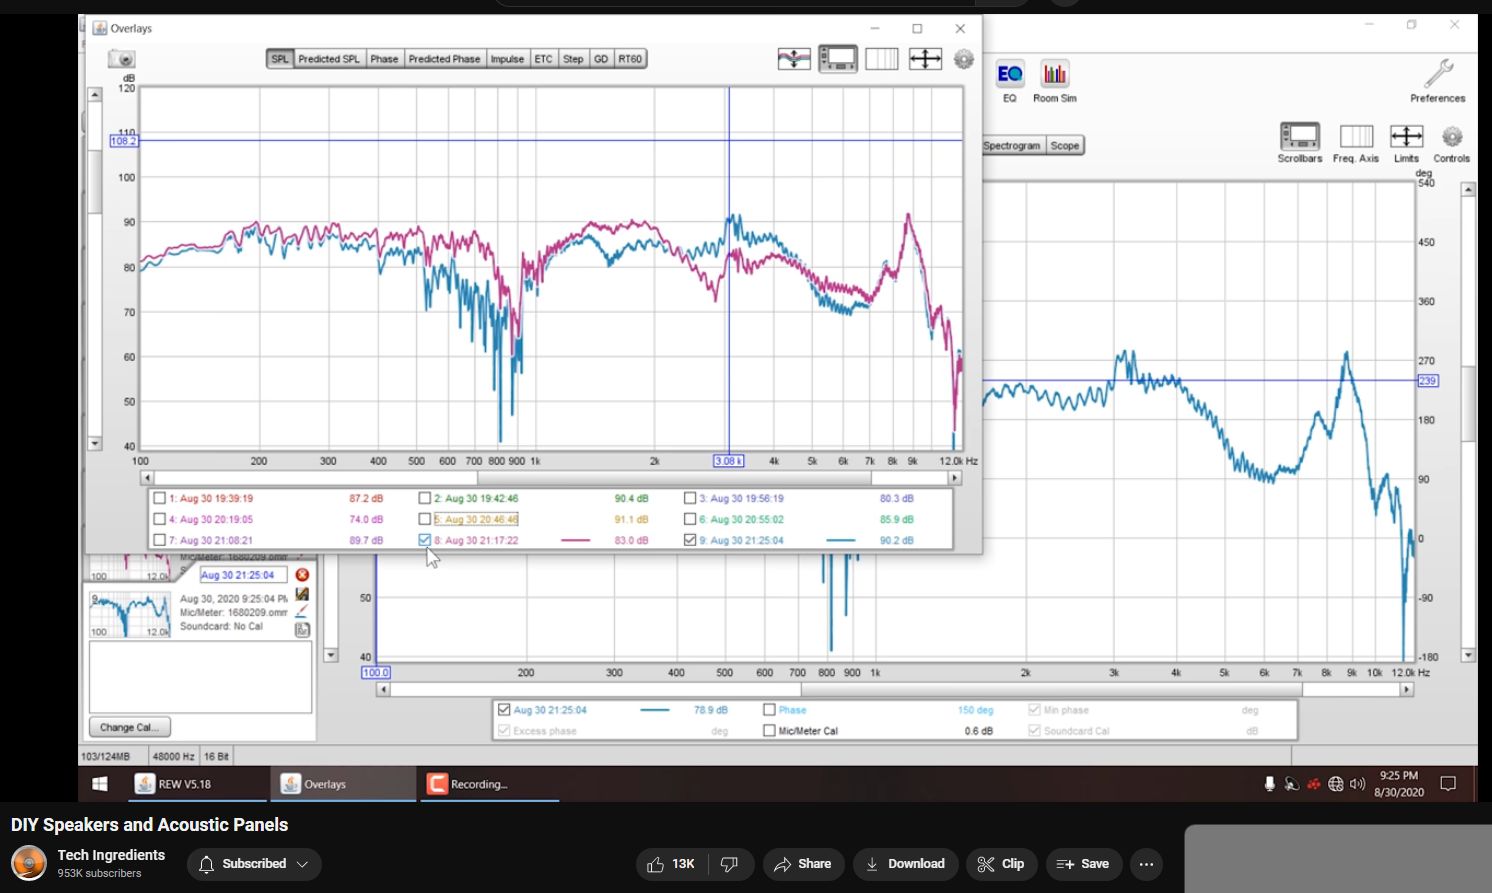
Anechoic chamber response — blue/purple is speaker-forward facing; red is speaker-rear facing (into absorptive lining).
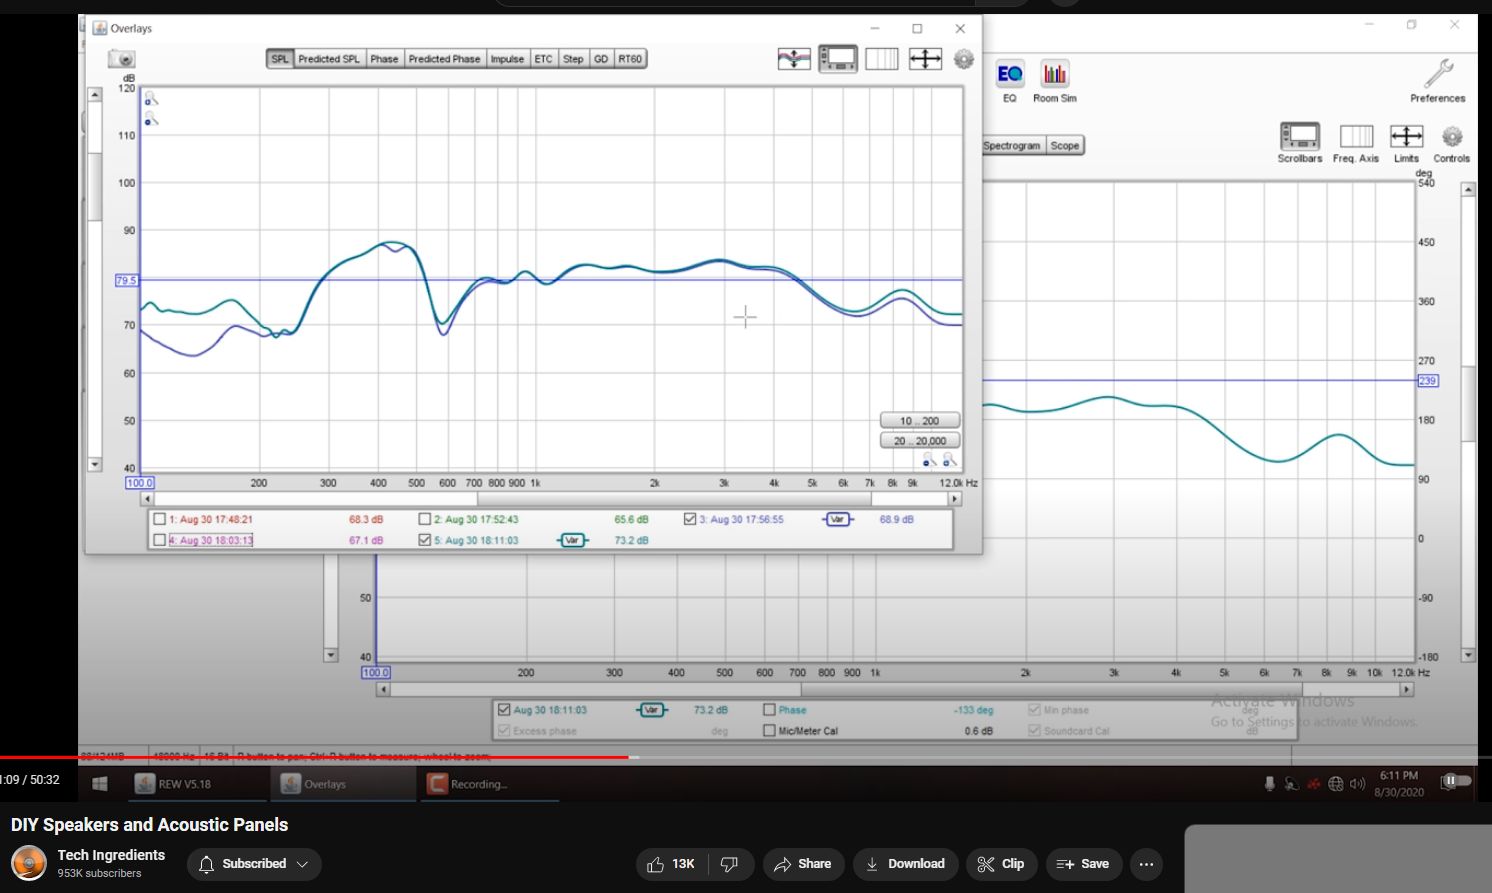
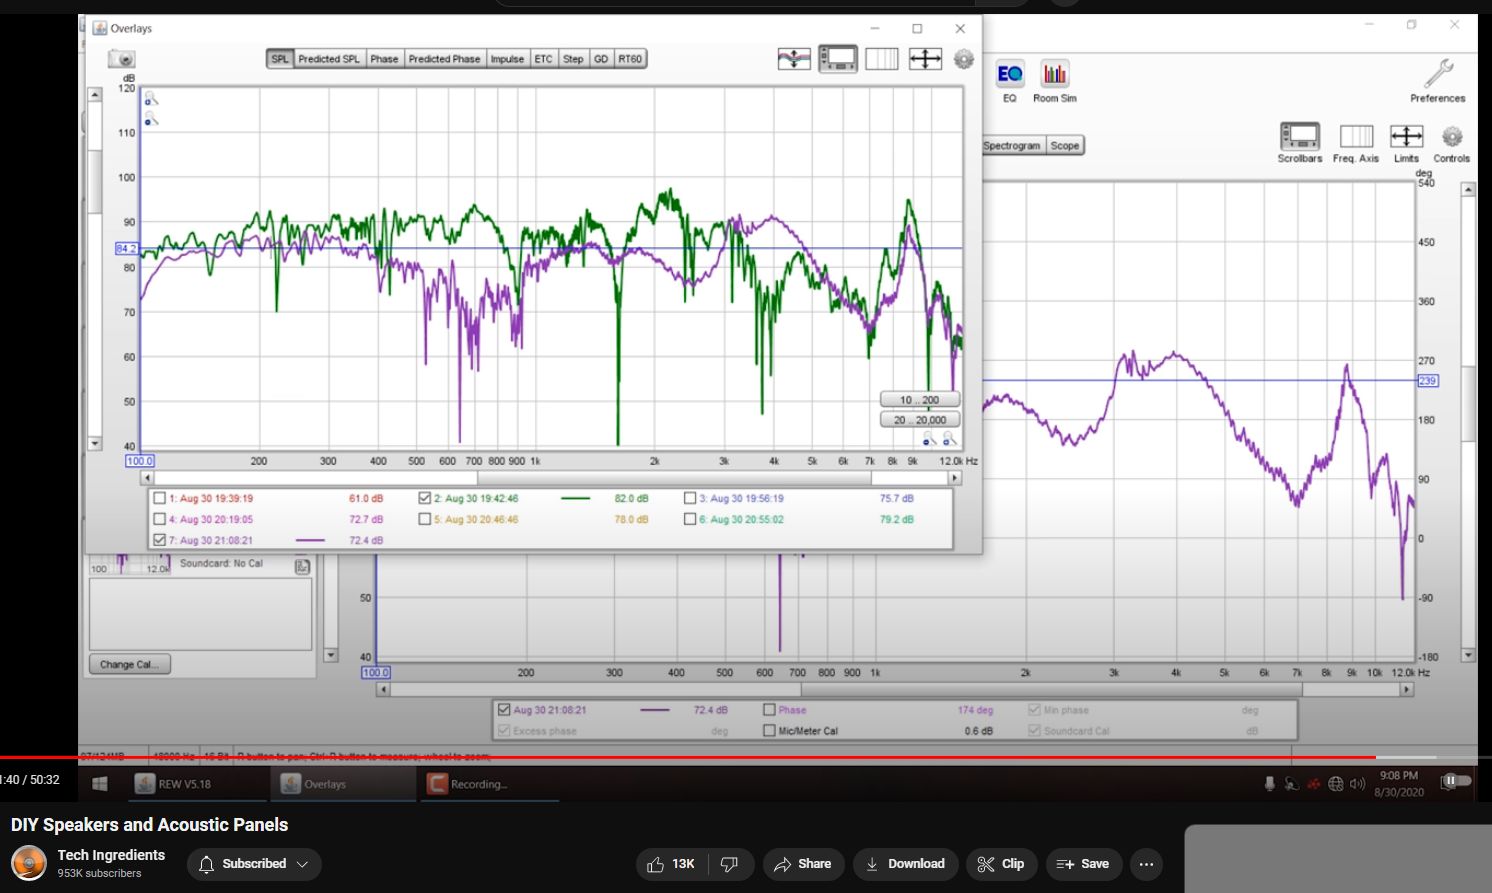
Ported vs Sealed. Ported gives overall more bass output (+5dB), all other factors approximately equal. Green is ported; blue/purple is sealed.
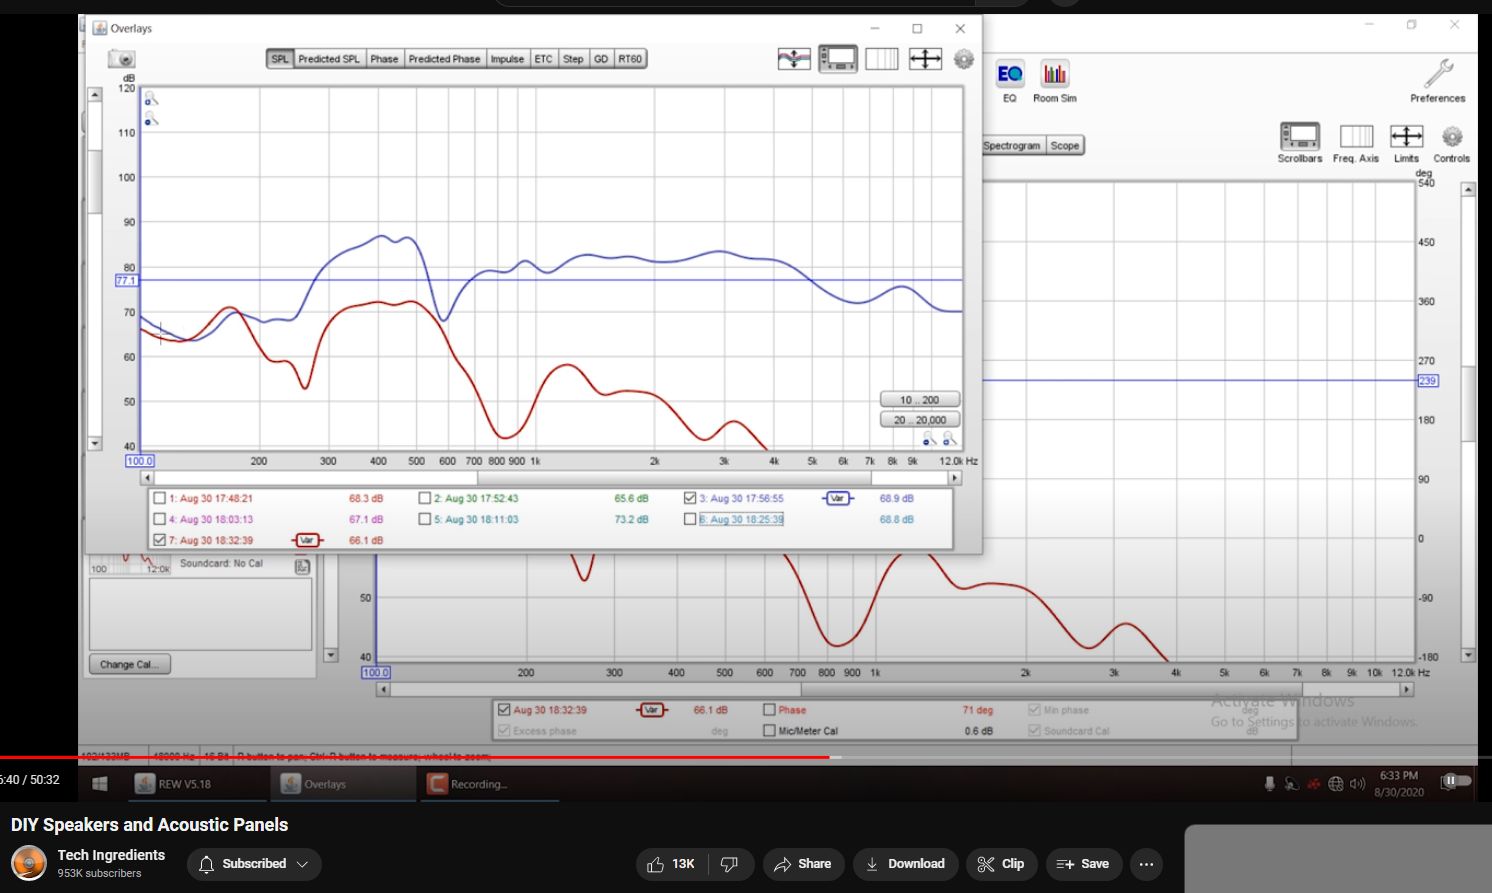
Ported vs Sealed and Insulated. Overall you DO NOT want to have sealed box nor have any “stuffing” inside the box. Green is ported. Lavendar is sealed and stuffed / insulated. The EQ is dramatically worse and power-wasteful. This goes directly against professional advice from many years ago.
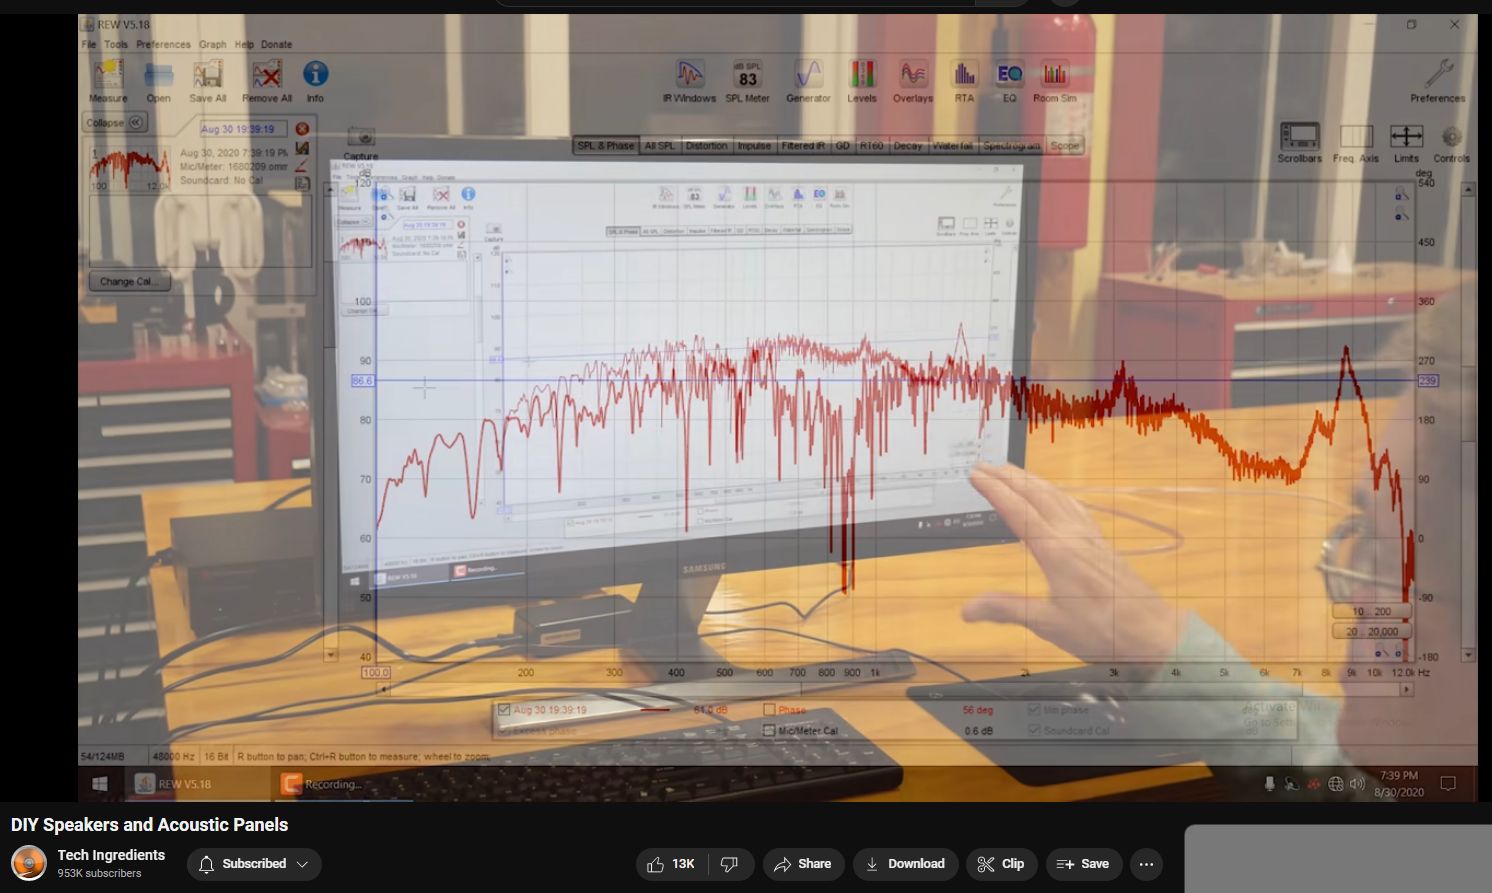
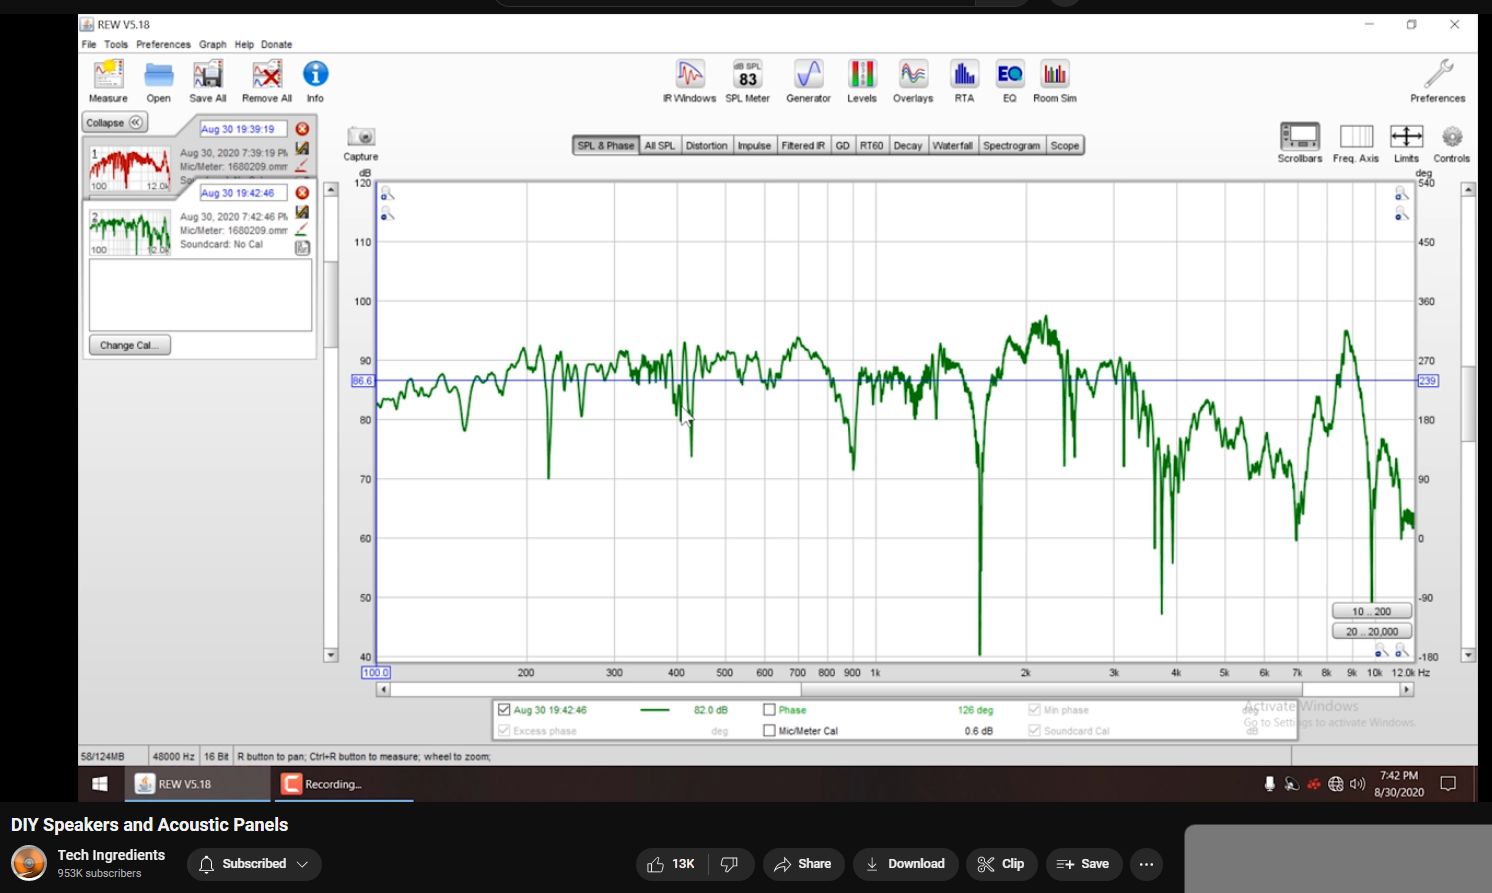
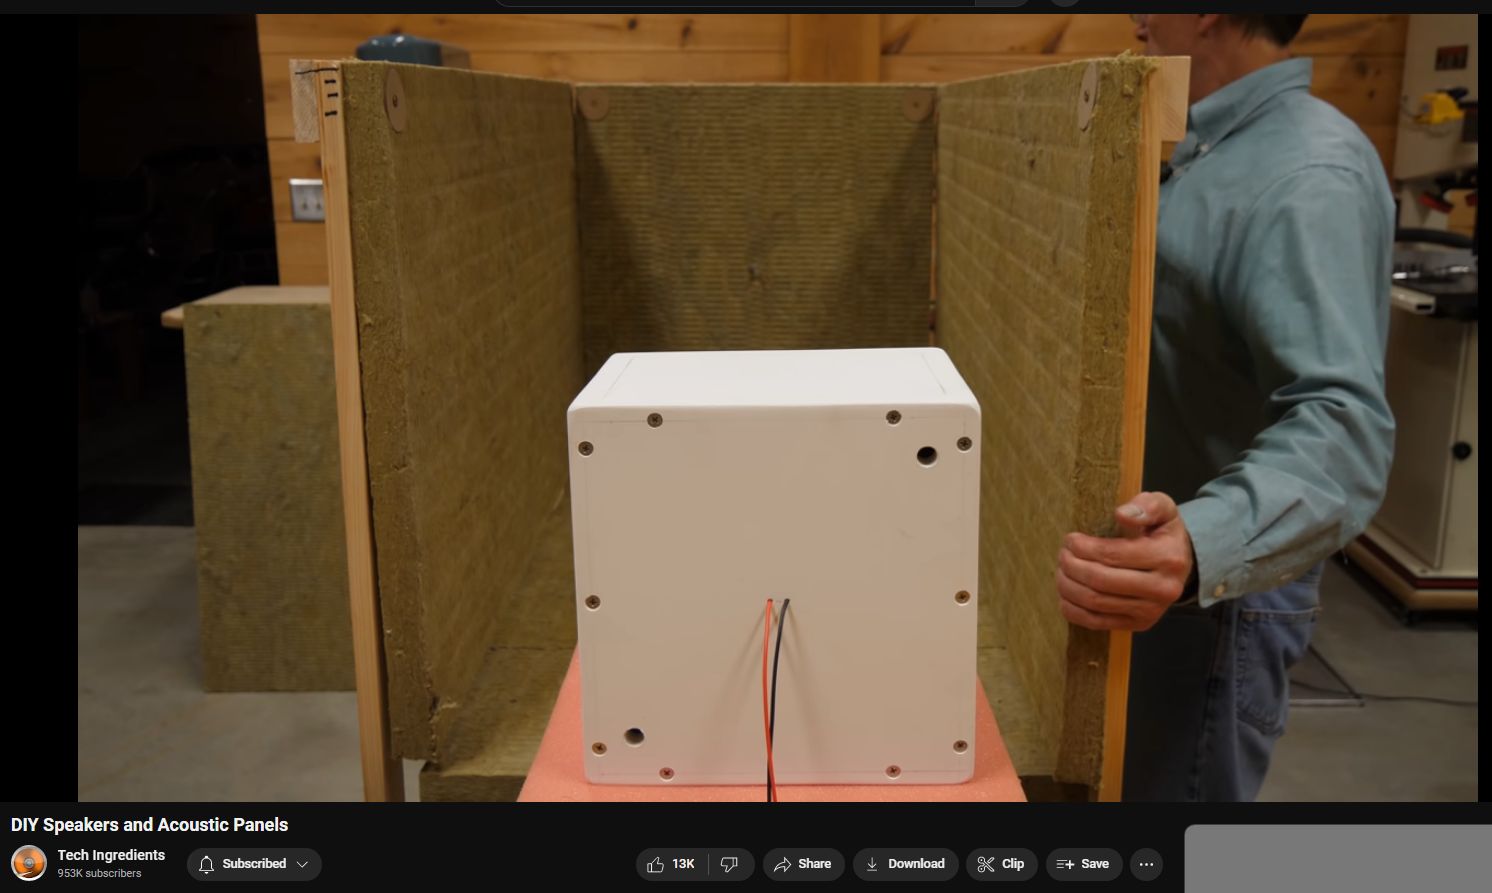
Lab room acoustics / reflections — tremendous unwanted comb filtering.
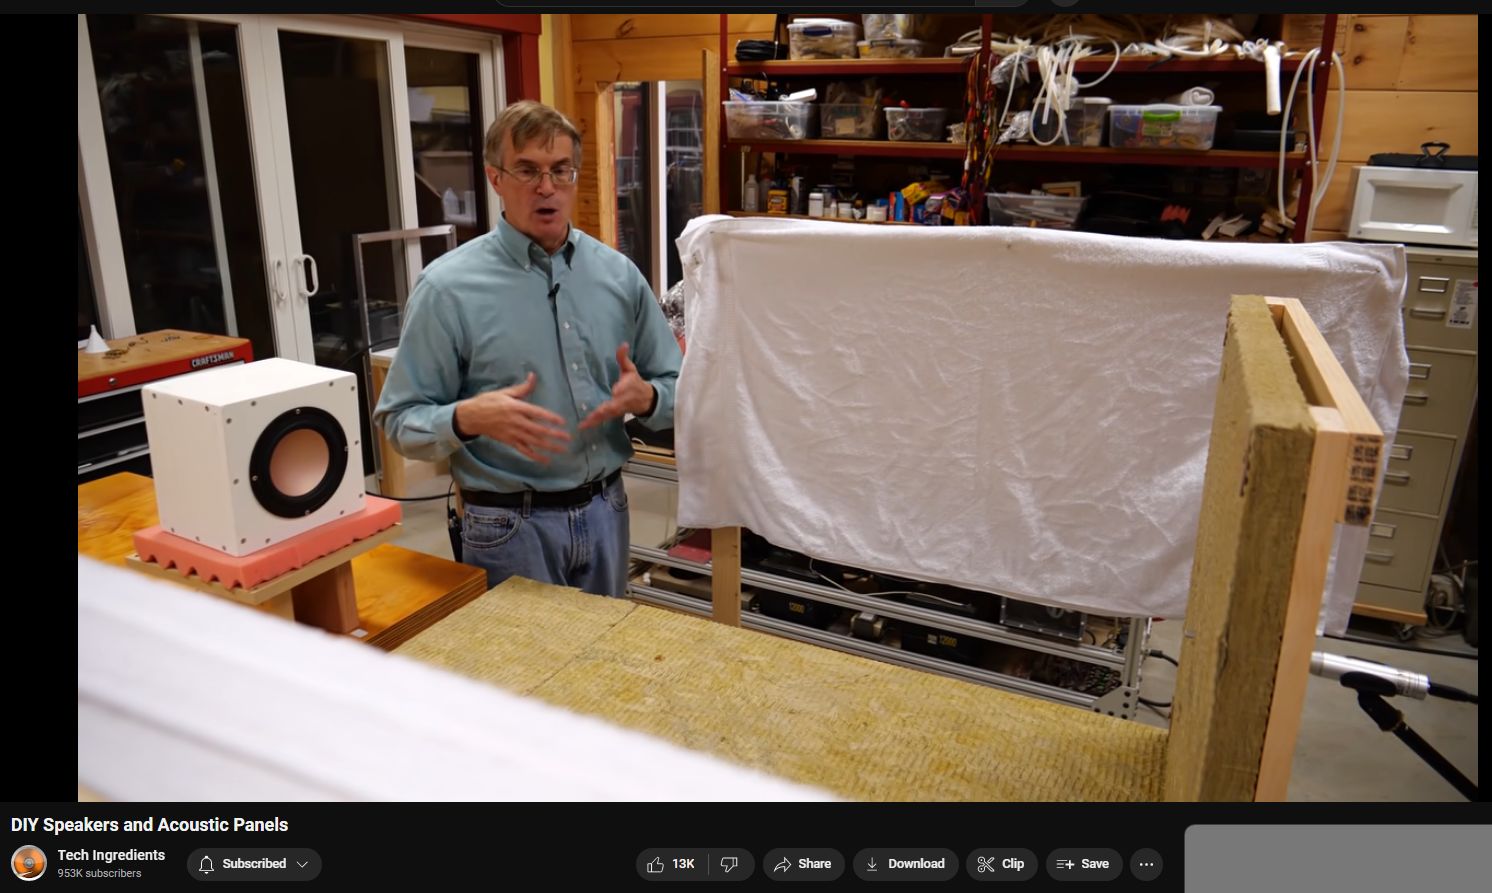
Response of speaker in tunnel. The room acoustics are notably reduced. Troughs are thought to be material (tunnel wood) resonances not adding to / reflecting sound back into tunnel but rather coupling it out into the larger room atmosphere/environ.
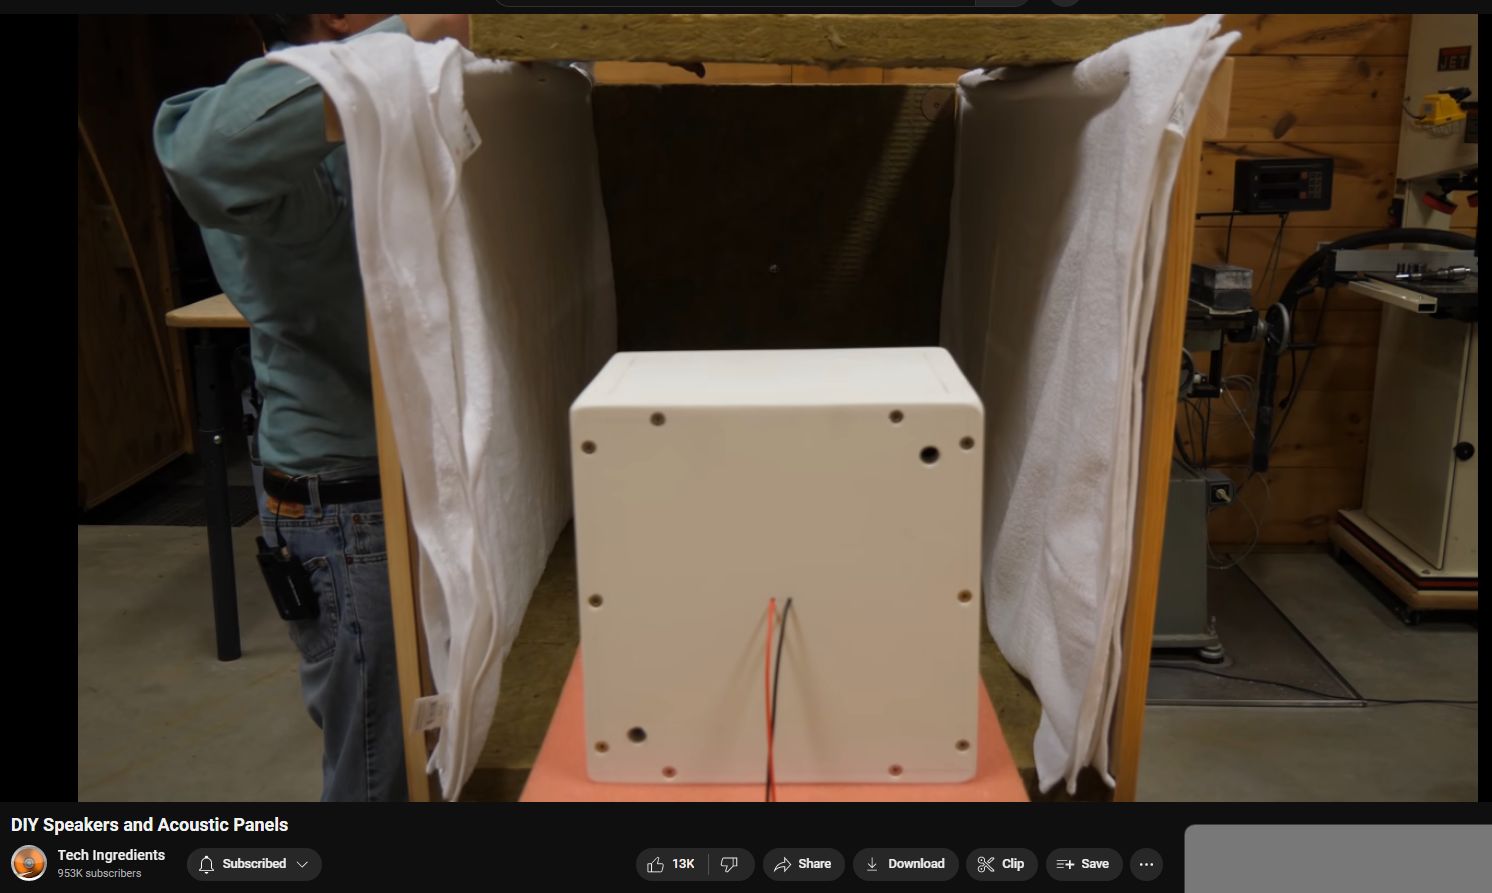
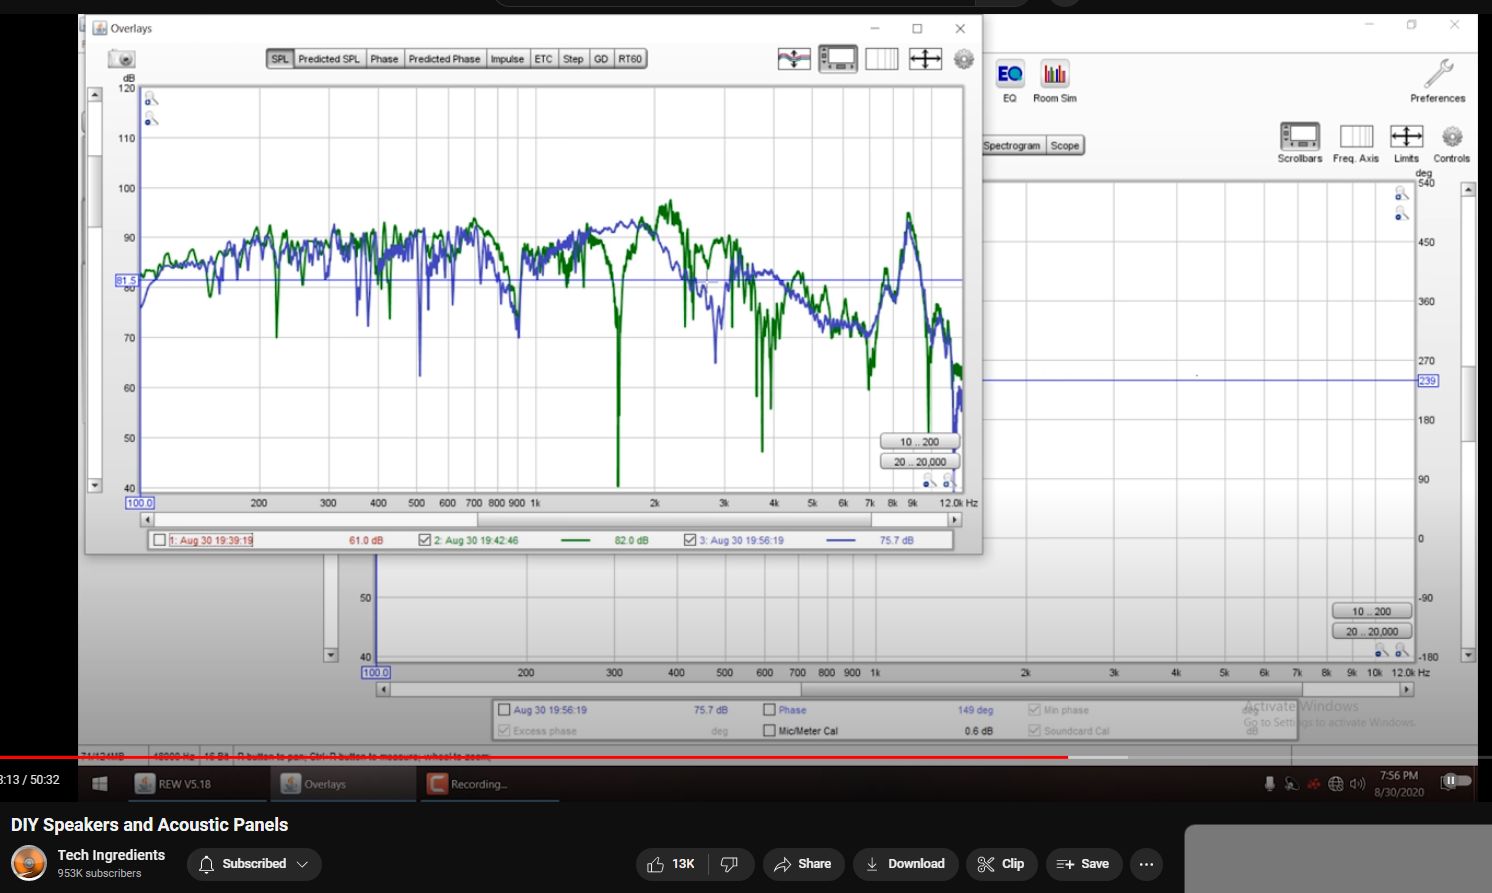
Testing efficacy of bath towels draped on tunnel walls. Some reduction of mid- and high-end energy sucking.
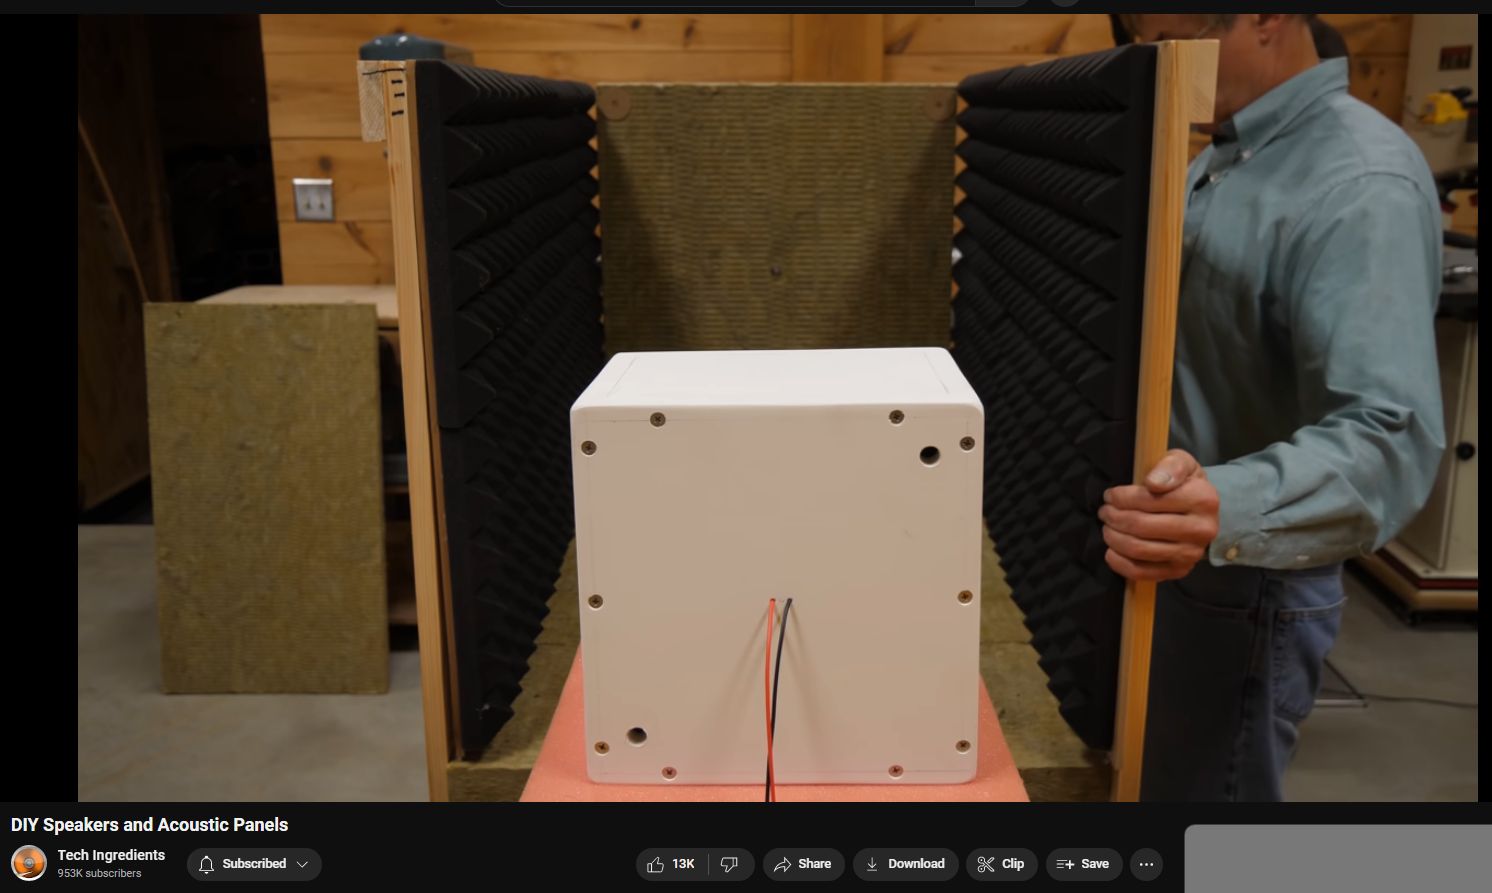
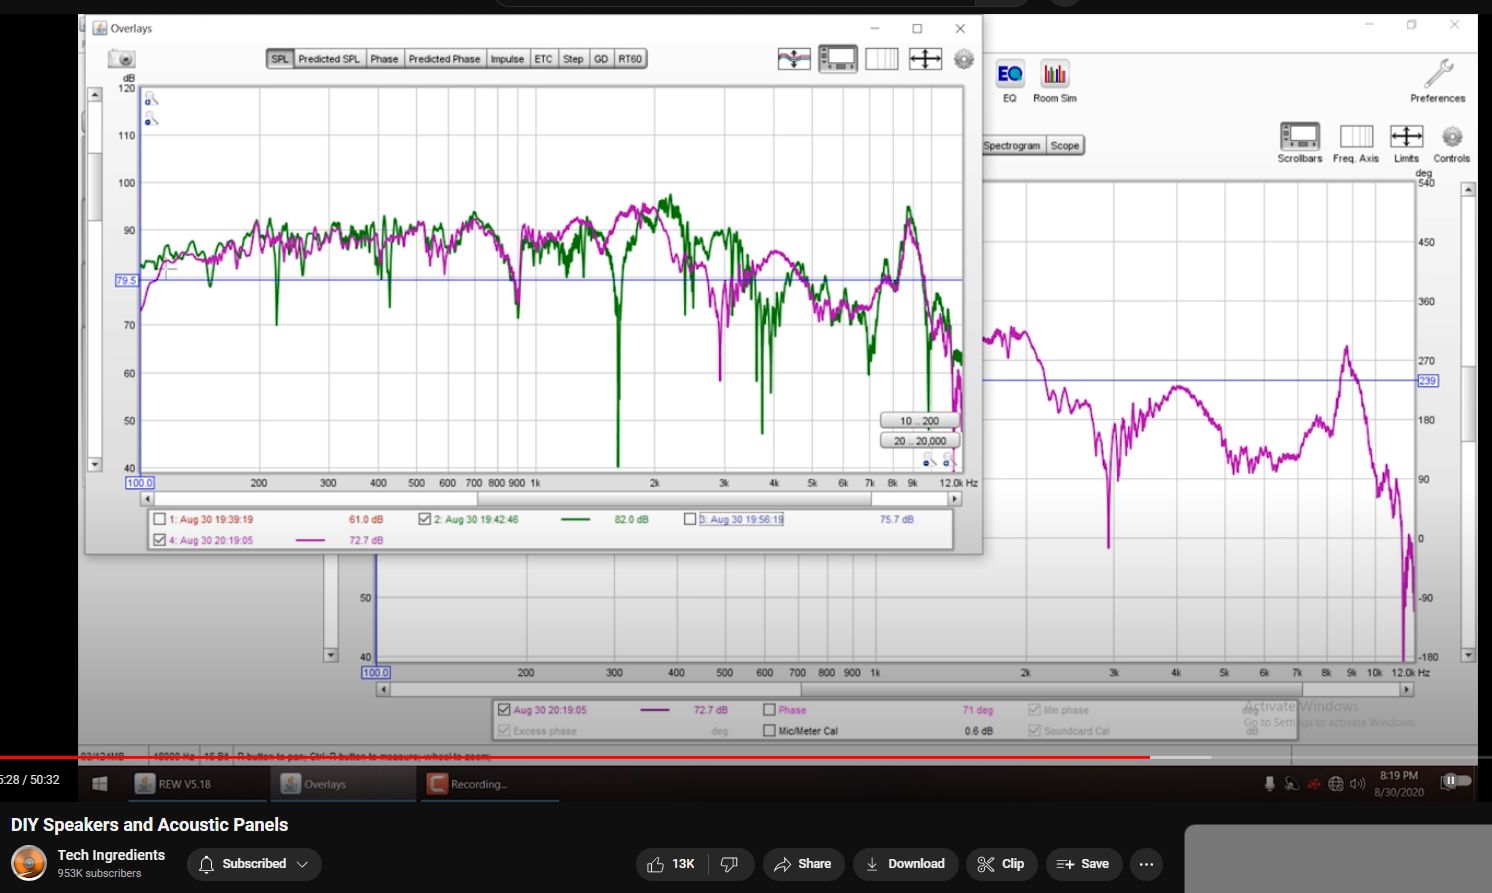
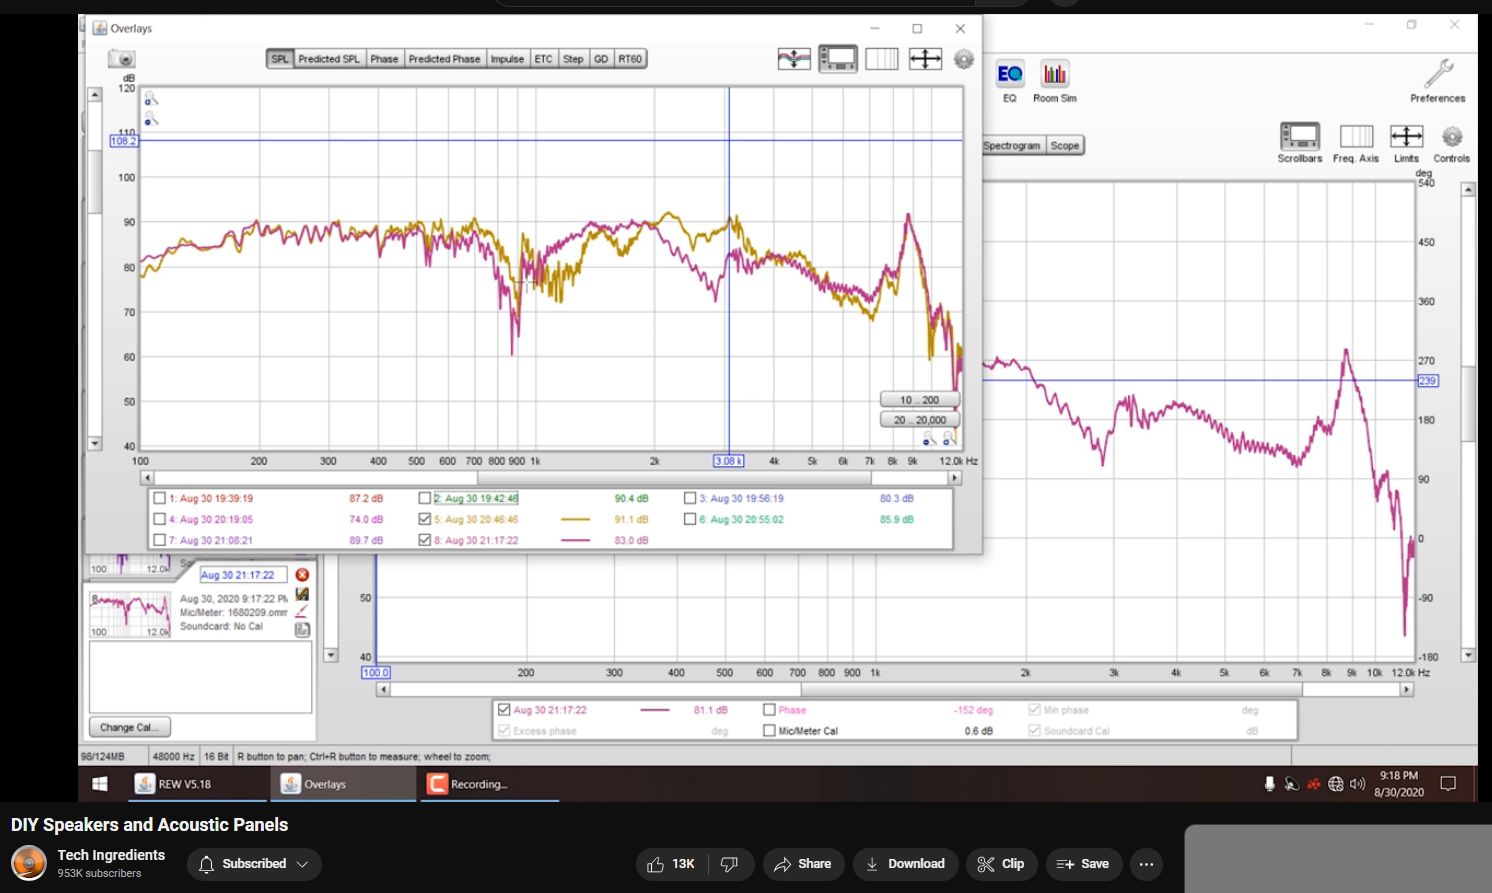
Effect of Pyramid Foam (expensive). Green is raw tunnel. Lavendar is Pyramid Foam.
Standard fiberglass acoustic ceiling panels (quite good) except for being fiberglass.
Egg cartons (cheap). Light. Not recommended compared to other treatments.
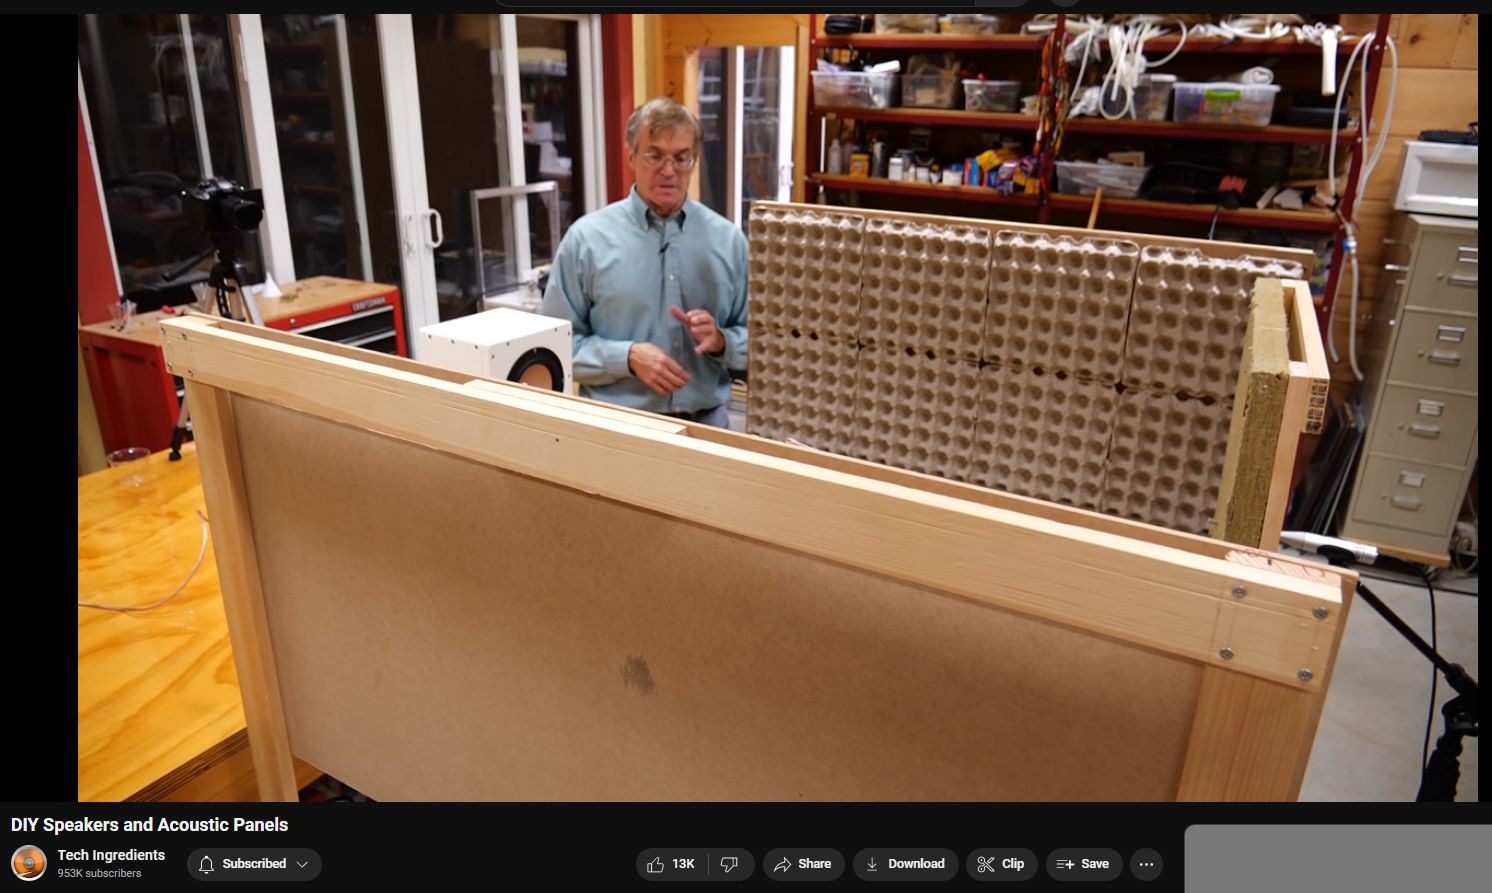
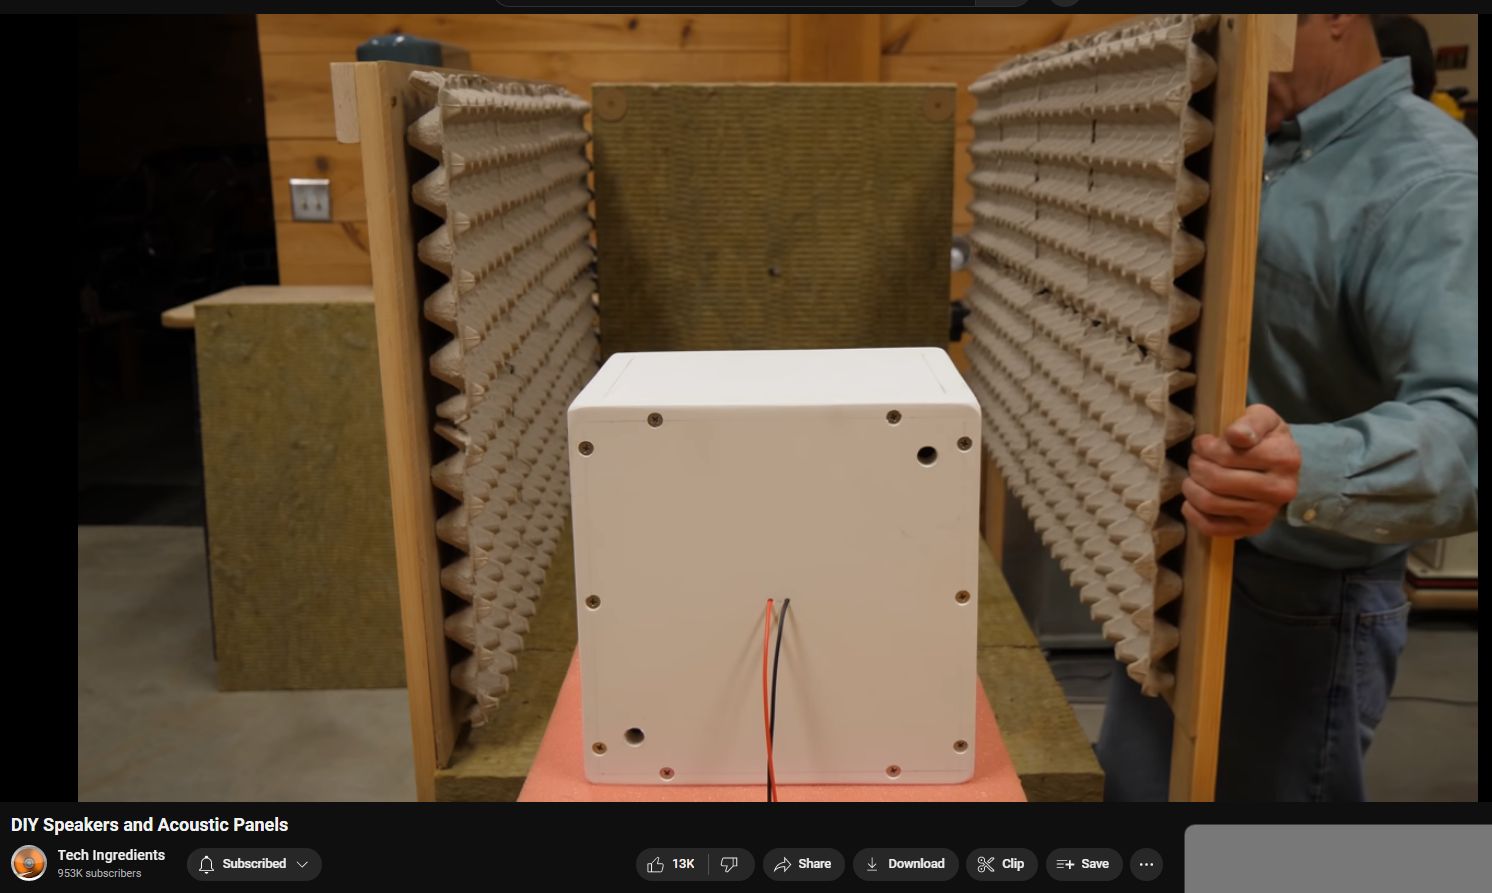
Egg Cartons vs Standard Fiberglass Acoustic Ceiling Panels
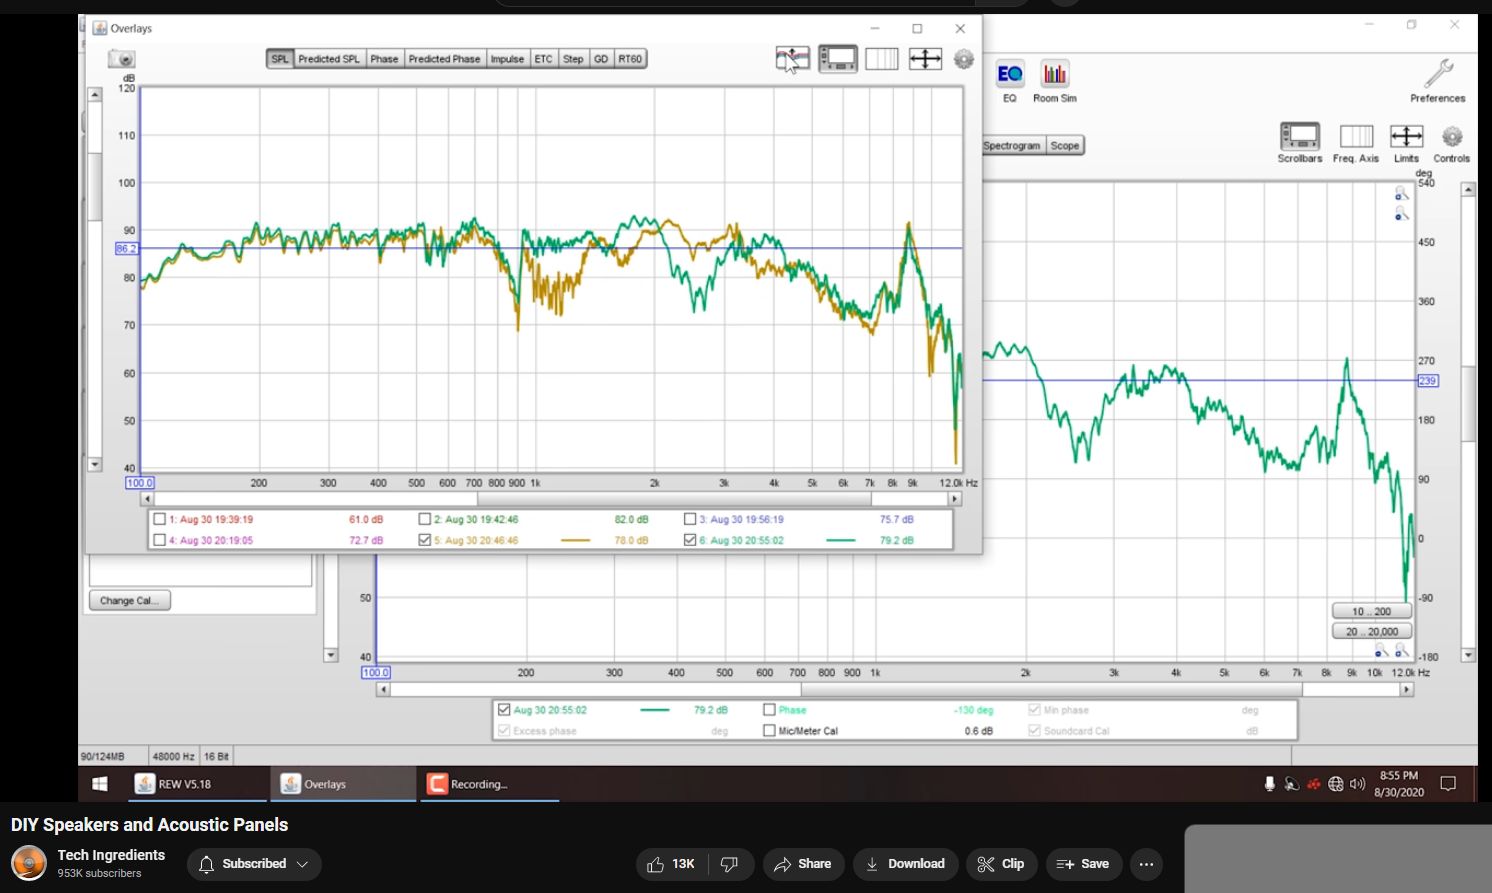
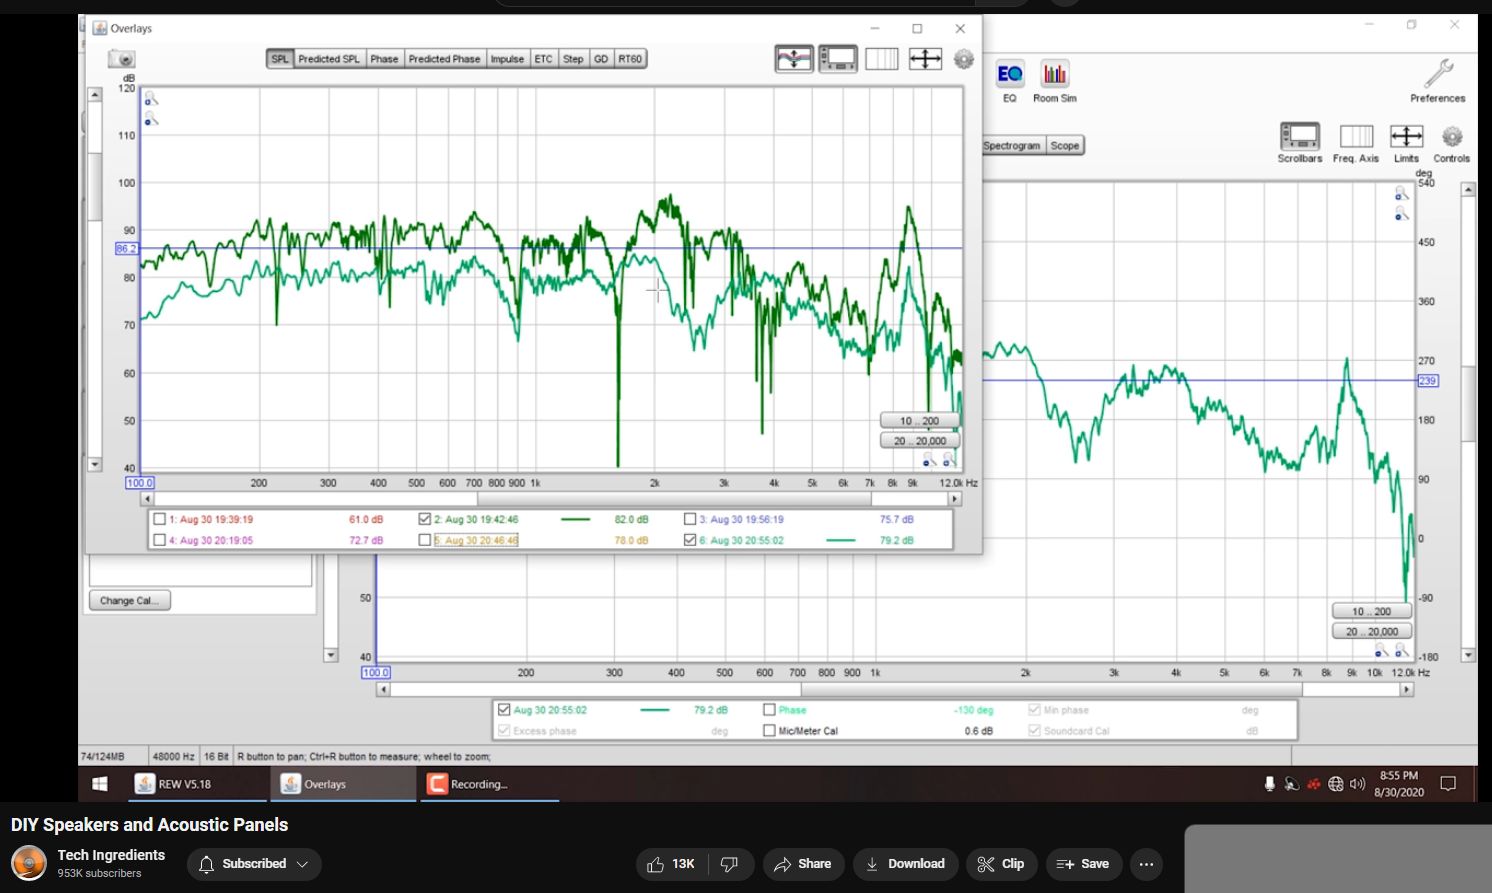
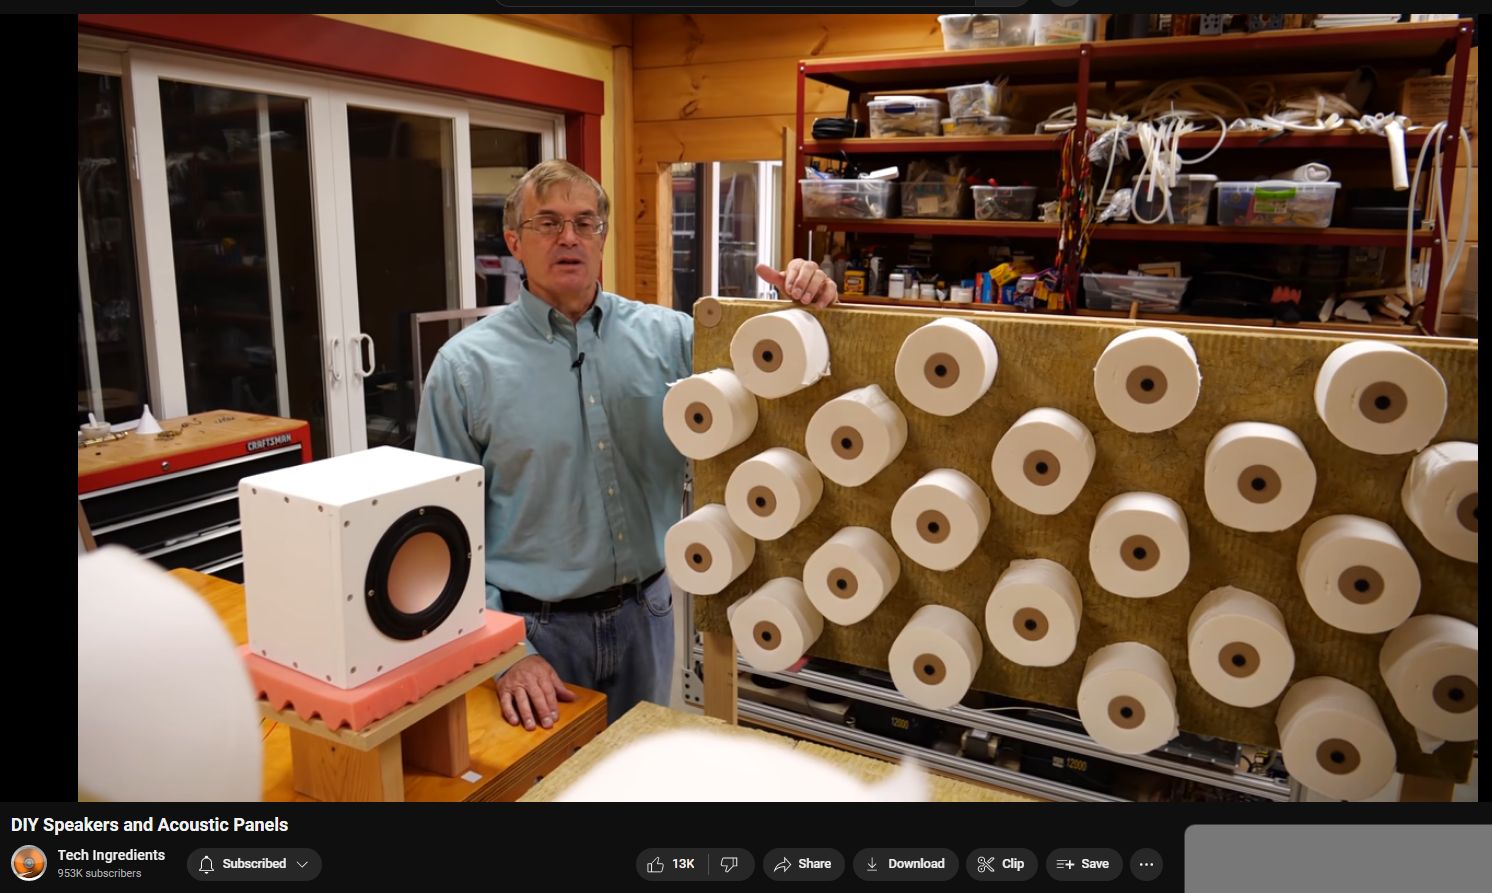
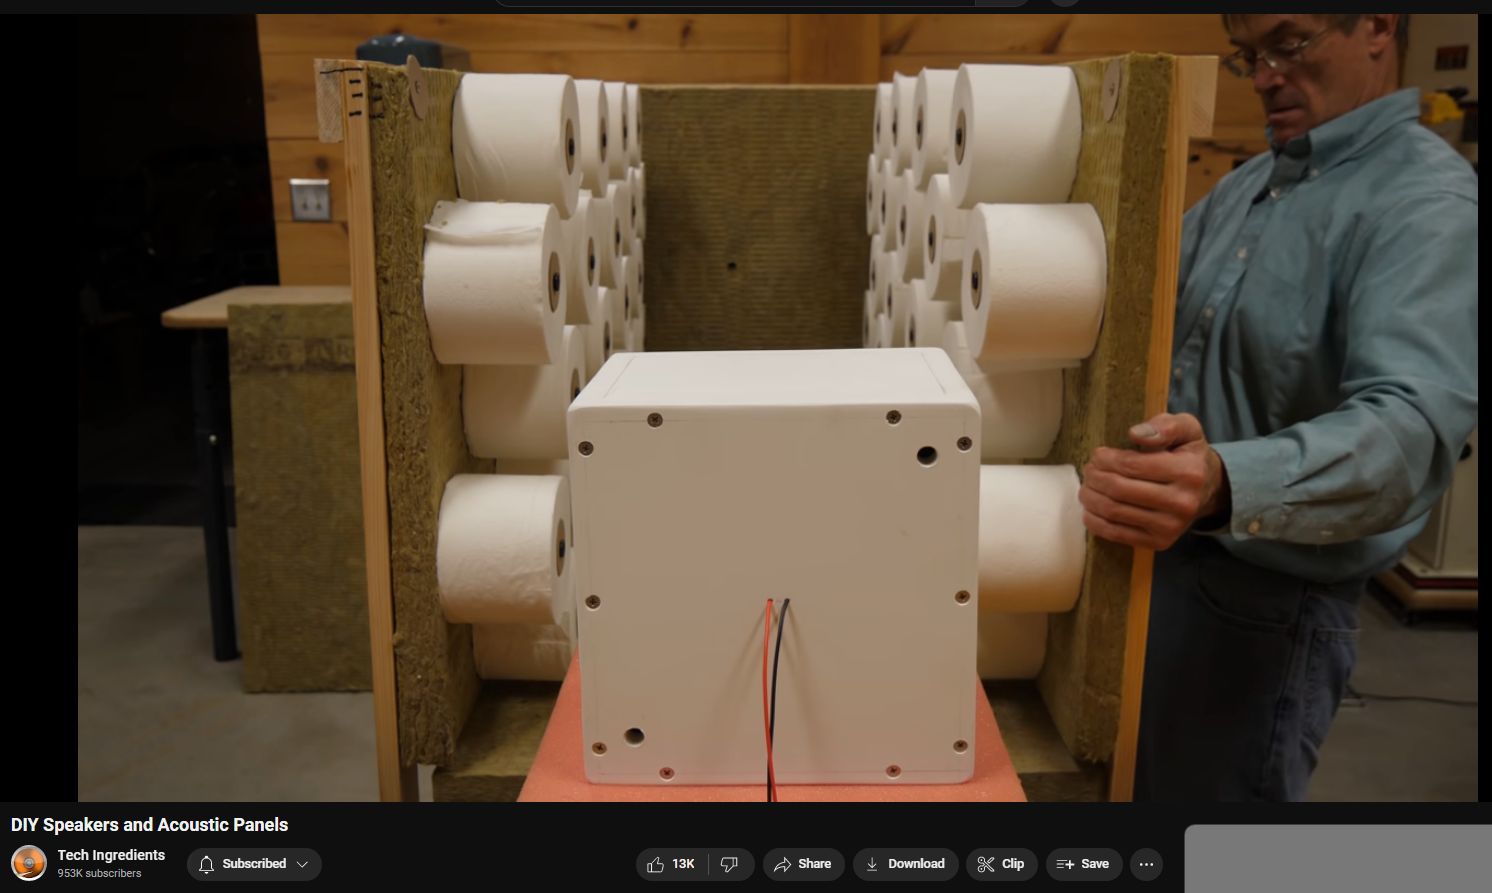
Toilet Paper — remarkable high-frequency equalization. Possibly the geometry of the rolls reduced reflective comb interferences.
TP vs Ceiling Panels. TP comby in mid/low but excellent high EQ.
TP vs raw tunnel.
Rockwool pads (wool, not fiberglass).
Rockwool pads vs Fiberglass Ceiling Panels.
Pads plus Pyramids. Actually worse.
Measuring speakers involves assessing various parameters to characterize their performance accurately. Here are some common measurements used to evaluate speakers:
1. Frequency Response: Frequency response measures a speaker’s output level across the audible frequency range, typically from 20 Hz to 20 kHz. It indicates how evenly the speaker reproduces different frequencies. An ideal speaker has a flat frequency response, meaning it produces all frequencies equally. Measurements are often presented graphically as a frequency response curve.
2. Impedance: Impedance refers to the opposition to the flow of alternating current (AC) presented by the speaker. It is measured in ohms and varies with frequency. Knowing the impedance helps determine how much power the speaker will draw from the amplifier and ensures compatibility with the amplifier’s output.
3. Sensitivity: Sensitivity measures a speaker’s efficiency in converting electrical power into sound output. It is usually expressed in decibels (dB) and represents the sound pressure level produced by the speaker when driven by a specified input power level at a defined distance. Higher sensitivity ratings indicate more efficient speakers.
4. Distortion: Distortion measures any deviation between the input signal and the reproduced sound. It can occur due to nonlinearities in the speaker’s driver components or amplifier clipping. Distortion measurements assess both harmonic distortion (distortion at integer multiples of the input frequency) and non-harmonic distortion.
5. Directivity: Directivity describes how a speaker’s sound radiation pattern varies with frequency and angle. It determines the speaker’s coverage area and how sound propagates in different directions. Directivity measurements assess the speaker’s dispersion characteristics and off-axis response.
6. Crossover Frequency and Slope: For multi-driver speaker systems, measurements of crossover frequency and slope indicate where and how steeply the speaker transitions between different driver units (e.g., tweeter and woofer). Properly designed crossovers ensure smooth integration between drivers and minimize phase issues.
7. Power Handling: Power handling measures the maximum amount of electrical power that a speaker can safely handle without damage. It is typically specified as both the continuous (RMS) power rating and the peak power rating.
These are just a few of the key measurements used to evaluate speakers. Manufacturers often provide specifications based on these measurements to help consumers understand a speaker’s performance characteristics. Additionally, professional audio engineers and enthusiasts may use specialized equipment and techniques for more detailed speaker measurements in controlled environments.