The Discordant Eardrum Chaotic and Superior above 3 kHz
Abstract
“At frequencies above 3 kHz, the tympanic membrane vibrates chaotically. By having many resonances, the eardrum can transmit the broadest possible bandwidth of sound with optimal sensitivity. In essence, the eardrum works best through discord. The eardrum’s success as an instrument of hearing can be directly explained through a combination of its shape, angular placement, and composition. … The asymmetric eardrum with collagen fibers achieves optimal transmission at high frequencies by creating a multitude of deliberately mistuned resonances. The resonances are summed at the malleus attachment to produce a smooth transfer of pressure across all frequencies.”
Content
The discordant eardrum
Jonathan P. Fay *, Sunil Puria * , † , ‡ , and Charles R. Steele *
Author Affiliations
Edited by Eric I. Knudsen, Stanford University School of Medicine, Stanford, CA, and approved November 3, 2006 (received for review May 13, 2006)
AbstractFull TextAuthors & InfoFiguresSIMetricsRelated ContentPDFPDF + SI
Next Section
Abstract
At frequencies above 3 kHz, the tympanic membrane vibrates chaotically. By having many resonances, the eardrum can transmit the broadest possible bandwidth of sound with optimal sensitivity. In essence, the eardrum works best through discord. The eardrum’s success as an instrument of hearing can be directly explained through a combination of its shape, angular placement, and composition. The eardrum has a conical asymmetrical shape, lies at a steep angle with respect to the ear canal, and has organized radial and circumferential collagen fiber layers that provide the scaffolding. Understanding the role of each feature in hearing transduction will help direct future surgical reconstructions, lead to improved microphone and loudspeaker designs, and provide a basis for understanding the different tympanic membrane structures across species. To analyze the significance of each anatomical feature, a computer simulation of the ear canal, eardrum, and ossicles was developed. It is shown that a cone-shaped eardrum can transfer more force to the ossicles than a flat eardrum, especially at high frequencies. The tilted eardrum within the ear canal allows it to have a larger area for the same canal size, which increases sound transmission to the cochlea. The asymmetric eardrum with collagen fibers achieves optimal transmission at high frequencies by creating a multitude of deliberately mistuned resonances. The resonances are summed at the malleus attachment to produce a smooth transfer of pressure across all frequencies. In each case, the peculiar properties of the eardrum are directly responsible for the optimal sensitivity of this discordant drum.
collagen fibers hearing sensitivity middle ear transducers
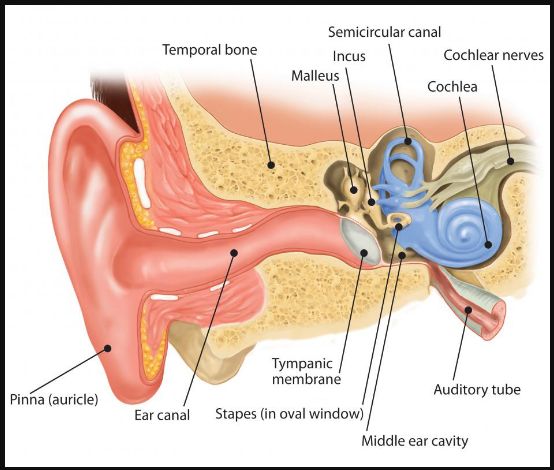
The function of the middle ear in terrestrial mammals is to transfer acoustic energy between the air of the ear canal to the fluid of the inner ear. The first and crucial step of the transduction process takes place at the tympanic membrane, which converts sound pressure in the ear canal into vibrations of the middle ear bones. Understanding how the tympanic membrane manages this task so successfully over such a broad range of frequencies has been a subject of research since Helmholtz’s publication in 1868 (1, 2).
Even though the function of the eardrum is clear and the anatomy of the eardrum is well characterized, the connection between the anatomical features and the ability of the eardrum to transduce sound has been missing. The missing structure-function relationships can be summarized by the following three questions. Why does the mammalian eardrum have its distinctive conical and toroidal shape? What is the advantage of its angular placement in the ear canal? What is the significance of its highly organized radial and circumferential fibers?
The shape of the human and feline eardrum is known from detailed Moiré interferometry contour maps (refs. 3 and 4 and Fig. 1 a). From the contour maps, three-dimensional reconstructions reveal the striking similarity of the two eardrums. In both cases, the eardrum has an elliptical outer boundary, whereas the central portion has a distinctive conical shape (Fig. 1 b). As one moves away from the center, the cone starts to bend forming an outer toroidal region (Fig. 1 b and c).
Fig. 1.
In a new window Download PPT
Fig. 1.
Eardrum anatomy and microstructure. (a) Contour plot of cat tympanic membrane using Moiré interferometry (4) with slice lines used to divide the eardrum. (b) Each slice in a is fit in the inner section as a cone and in the outer section as a toroid. This slice is from the anterior-superior quadrant, but the fit to the contour data (red squares) is typical. (c) Approximation of the eardrum obtained after slicing and fitting with cone and toroid sections. The blue line represents the annulus of the eardrum. (d) Schematic representation of the thickness profile for each slice from the umbo to the outer edge (annulus). The thickness is taken to taper linearly toward the umbo. The vertical dimension is greatly exaggerated to illustrate the four-layer composite of the eardrum. The inner radial and circumferential collagen fiber layers provide the scaffolding for the tympanic membrane (8, 11).
The angular placement of the eardrum within the ear canal is well documented. Measurements of the cat ear canal indicate that the angle between the eardrum and the inferior canal wall ranged between 30° and 45° (5). In humans, the angle is between 45° and 60° (6). In the human and cat, the eardrum forms the superior wall of the ear canal rather than being a nearly perpendicular termination of the canal as is often depicted.
The eardrum consists of a large pars tensa area and a smaller pars flaccida area. The pars flaccida is more compliant than the pars tensa, and thus its mechanical significance is less important except in some desert animals like the gerbil (7). The pars tensa is composed of four main layers (Fig. 1 d shows a schematic representation): an outer epidermal layer, two fibrous collagen-fiber layers in the lamina propria segment, and an inner mucosal layer. Scanning electron micrographs show a well organized arrangement of circular and radial fibers (8, 9). The two separate fibrous collagen layers of the eardrum are unique to mammals (reviewed in ref. 10). The radial fibers are the dominant fiber layer within the inner conical region of the eardrum. As one progresses outward into the toroidal region, the fiber density and thickness of the circumferential fiber layer gradually increases. Eventually, the circumferential fibers become very dense and form the annular ligament, where the eardrum attaches to the ear canal wall. The collagen fiber layers determine the mechanical stiffness of the eardrum. The outer epidermal and the inner mucosal layers are relatively flexible, and they mostly contribute to the overall mass of the eardrum. Because the subepidermal layer and the submucosal layer consist of connective tissue and are also relatively flexible, they are part of the epidermal and mucosal layers, respectively (Fig. 1 d). An extensive review of the layers that make up the eardrum can be found in the literature (10-12). A detailed description of the fiber layers has not been previously incorporated into a model of the eardrum (13-18).
In this work, these anatomical features have been embodied into a mathematical model of the eardrum and ear canal [see supporting information (SI) Fig. 6]. The model encompasses experimentally measured geometries and orientations of the ear canal, eardrum, and middle ear bones. The best available estimates for material properties of the eardrum were used. In addition, the acoustics of the ear canal were fully coupled to the vibration of the eardrum. The open middle ear cavity was represented as a radiation impedance. The model used a combination of rigid bodies, finite element, and asymptotic methods to ensure accuracy over the entire frequency range of 200 Hz through 20 kHz. By using a combination of methods, the strengths of each were exploited while avoiding their shortcomings. The specifics of the model are discussed in more detail in Methods. The animal of choice was the domestic cat (Felis catus) because there is a significant amount of anatomical data, physiological data, and material properties known for the middle ear of that species. It is also an animal that spans a relatively wide frequency range (19, 20).
Previous Section
Next Section
Results
To validate the mathematical model, five different outputs were compared against experimental measurements: ear canal impedance and reflectance, umbo (center of the eardrum near the malleus tip) velocity to ear-canal-pressure ratio, middle-ear-cavity pressure to ear-canal-pressure ratio, middle-ear pressure gain, and eardrum displacement patterns. Some of these results were for the open middle-ear cavity case, whereas others were for the closed cavity case. All showed agreement between the measured and calculated responses. Two of these five results, for the open cavity case, are shown in Fig. 2 (see SI Figs. 7 and 8 for ear canal impedance and reflectance comparisons). Fig. 2 a compares the ear-canal-pressure to vestibule-pressure transfer function, or the middle-ear pressure gain, of the model to the range of experimental values (21, 22). The measured magnitude varies by approximately 䔮 dB, which is not atypical for physiological measurements. The model results agree with magnitude, particularly on the high-frequency side, and phase data. Perhaps the most difficult validation test is to match the irregular surface vibration patterns of the eardrum. The calculated surface displacements at four different locations on the eardrum are shown in Fig. 2 b along with actual measurements at similar locations (23). There is agreement in both the amplitude variations and the frequency, ᭯oo^2 kHz, where the large oscillations begin to occur.
Fig. 2.
In a new window Download PPT
Fig. 2.
Validation of eardrum model by comparing experimental data against model results. (a) Middle ear pressure gain: the ratio of the pressure in the vestibule of the cochlea to the pressure in the ear canal. Model result (black line) is compared with two sets of experimental results. The range of results reported by Nedzelnitsky (21) are within the gray area bounded by blue lines, whereas measurements by Decory et al. (22) are shown by the green lines. The model result agrees in both magnitude and phase with the experimental measurements. (b) Displacement measurements of four points on the eardrum relative to the center of the eardrum (umbo). Solid and dashed blue lines indicate measurements from Decraemer et al. (23), whereas black lines are the model calculations. The model correctly predicts the response magnitudes at each point. An exact match of the data and calculations is not expected given that only an approximate position of the measurements is known.
Our single model has been able to show both a smoothly varying middle-ear pressure transfer function (24) and the highly nonuniform displacement patterns seen experimentally (23, 25) for frequencies up to 20 kHz. For frequencies <3 kHz, the eardrum surface moves together in unison (Fig. 2 b) and the pressure transfer function is also smooth. Above 3 kHz, surface measurements reveal large oscillations on the eardrum, yet the pressure transfer function from the eardrum to the inner ear remains relatively smooth. The eardrum has good transmission properties by having so many resonances that no single resonance can dominate the response. The eardrum appears to have many mistuned resonances that average out to an overall high output at the malleus handle. This partially explains how, in a variety of species, sound transmission through the middle ear can have a wide bandwidth and not limit the sensitivity of hearing (26-29). With the model validated, the baseline response was used to explore the role of each anatomical feature by modifying the feature away from its naturally occurring state.
The results are insensitive to modest changes in the geometric and material properties. However, some larger alterations are shown in Figs. 3-5. First, the effect of changing the eardrum’s shape was explored. The results for the different eardrum cone depths shown in Fig. 3 a are plotted in Fig. 3 b. The deep eardrum response is about the same as the normal case with a slight loss at low frequencies and a slight gain at high frequencies. However, the shallow eardrum has a 25-dB loss at high frequencies. This result makes intuitive sense when the function of the eardrum is considered. The eardrum must transfer acoustic energy into motions of the malleus. Air has low mechanical impedance, whereas the mechanical impedance at the center of the eardrum, the umbo, is high. The eardrum must act as a transformer between these two impedances; otherwise, most of the energy will be reflected rather than transmitted. The mechanical transformer properties of the eardrum are derived from its shape and mechanical properties. The toroidal outer section is very flexible and has a large surface area. This flexibility provides the low impedance needed to match the low impedance of air. In contrast, the inner portion of the eardrum is a steep conical section with many radial fibers. These fibers are very stiff in the direction needed to drive the umbo. This stiff inner portion of the eardrum matches the large impedance of the umbo. Between these two regions, the eardrum smoothly transitions from low-impedance, transverse modes of vibration in the toroidal region to high-impedance, in-plane modes of vibration in the conical region. The wave speed of the in-plane motion is significantly slower than the speed of sound in air (12, 27). This behavior is reflected in the computational results. When the eardrum is made too shallow, its impedance matches the air, but it lacks the stiffness needed to drive the umbo. This effect is especially pronounced at high frequencies, as demonstrated by the shallow eardrum case. At the other extreme, increasing the conical portion raises the stiffness of the eardrum, which provides a poor match between the air and the eardrum. This is most clearly seen in the model at low frequencies.
Fig. 3.
In a new window Download PPT
Fig. 3.
Modification of the eardrum depth. (a) The anatomically normal eardrum. (Center) The z coordinate of all of the points is divided by a factor of 10 to obtain the shallow eardrum (Left), and multiplied by a factor of 2 to obtain the steep eardrum (Right). (b) Effect of eardrum depth on the middle ear pressure transfer function. The deep eardrum is nearly the same as the normal, but the shallow eardrum has a >20-dB loss at higher frequencies.
Next, the purpose of the inclination of the eardrum within the ear canal was examined. The response of an eardrum placed perpendicular to the ear canal was compared against the normal position. To make the eardrum perpendicular, one must adjust either the eardrum area or the ear canal area. There are two questions addressed by this analysis. The first is, “what is the effect due to the angle of the eardrum?” It was hypothesized that the tapered angle, which produces a narrowing of the canal in the anterior section, may result in air pressure being “trapped” at frequencies where the wavelengths are short in comparison with the tapered dimensions. The second has to do with dimensional scaling of the model. Given that there are so many modes on the drum surface one might expect that dimensionally scaling the area could dramatically alter the sound transmission to the cochlea.
As shown in Fig. 4 a, both possibilities were examined. In one case, the area of the eardrum was maintained. The ear canal was made larger to accommodate the new orientation. In the other case, the ear canal area was maintained, but the eardrum area was scaled to fit within the normal canal. The resulting pressure transfer functions are shown in Fig. 4 b. There is very little difference between the two cases when the eardrum size was maintained. However, when the eardrum is made smaller and the ear canal preserved, a simple area dependence occurs. This results in a 10-dB loss at all frequencies >2 kHz. One can conclude that the inclination of the eardrum allows a larger eardrum to fit inside a smaller ear canal diameter. This decreases the acoustic pressure in the ear canal needed to produce perceivable vibrations in the cochlea while at the same time optimizing the amount of space used.
Fig. 4.
In a new window Download PPT
Fig. 4.
Modification of the inclination of the eardrum within the ear canal. The anatomically normal position (Left). The same eardrum at 90° with a correspondingly enlarged ear canal (Center). The eardrum is also at 90°, but made smaller to fit in the normal ear canal (Right). (b) The middle ear pressure transfer function shows that the performance drops for the smaller eardrum. No loss occurs when the size of the eardrum is maintained. The advantage of inclination is that a given ear canal can fit a larger eardrum. The phase curves show little difference.
Although the angled eardrum did produce an increase in pressure in the inferior portion of the ear canal (data not shown), in comparison with the perpendicular drum of the same area, it did not produce an increase in sound transmission to the cochlea disproportionately at the high frequencies. When scaling the area of the eardrum, one must also scale the thickness as well. If one decreases the area alone, the eardrum becomes too stiff to be an effective sound transducer. Here, the eardrum thickness was scaled down so that the first resonant frequency of the eardrum was preserved (data not shown). Thus, sound transmission to the cochlea in the high-frequency region (>2 kHz) does scale proportionally with eardrum area, as expected. However, <1 kHz, the pressure transfer function will asymptotically approach the angled case as a result of the thickness scaling used.
The effect of changing the eardrum’s fibrous structure was explored last. The three different eardrum structures shown in Fig. 5 a were compared. In all cases, the shape and thickness profiles were held fixed. The first type of structure examined was an isotropic eardrum. Because most eardrum modeling attempts in the past have treated the eardrum as an isotropic structure (15-18), this case provides a comparison with the previous literature. For the isotropic case, the response was computed for two different values of elastic modulus. The second type of structure examined closely approximates the actual eardrum using the anatomical information currently available. The eardrum is radially orthotropic, but the relative stiffness in the circumferential (E0 ) and radial (Er ) directions change with position. Near the outer edge of the eardrum, the circumferential and radial stiffness are nearly equal. Moving inward toward the umbo, the radial stiffness increases as the radial fibers converge, whereas the circumferential fiber layer gradually disappears. This arrangement of fibers is depicted in Fig. 5 a Center. The third eardrum structure takes the orthotropic nature of the eardrum to an extreme. In this case, the effective elastic modulus in the circumferential direction is set to zero. Setting E0 = 0 eliminates the effect of the circumferential fibers.
Fig. 5.
In a new window Download PPT
Fig. 5.
Modification of the microstructure. (a) An isotropic eardrum (Left). Both circular and radial fiber layers are treated as isotropic sheets. The anatomically normal model (Center). All circumferential fibers have been eliminated (Right). (b) Effect of microstructure on the middle ear pressure transfer function. Compared with the normal, the isotropic eardrum shows significant loss, both for low frequency when the reference modulus near the tympanic annulus E = 0.1, and for the high frequency when E = 0.03. When all of the circumferential fibers are removed, E θ = 0, the transmission is increased for the low frequencies while being maintained at high frequencies.
The results for each eardrum are shown in Fig. 5 b. Comparing the isotropic cases with the anatomically realistic condition reveals a tradeoff. The isotropic case can be made to match the normal case in either the low frequency region or the high-frequency region, but not both at the same time. With an elastic modulus of E = 0.03 GPa, an isotropic eardrum is soft enough to match the impedance of the air at low frequencies but not stiff enough at high frequencies to drive the umbo. This results in a 20-dB transmission loss at frequencies >8-10 kHz. Note, however, that the output is smoothly varying, suggesting that spatial integration of the modes is taking place even for an isotropic drum. Conversely, with an elastic modulus of E = 0.1 GPa, an isotropic eardrum is stiff enough to drive the umbo at high frequencies but is too stiff at low frequencies, resulting in a 10-dB loss. The anatomical fiber arrangement in an asymmetrical eardrum seems to be a good compromise at all frequencies. In the case with no circumferential fibers, an improved low-frequency performance is predicted. However, there may be serious problems with maintaining the integrity of the eardrum without any circumferential fibers. Therefore, although this case has the best sound transmission, it may not be practically attainable. This sequence of calculations clearly demonstrates the advantages of an orthotropic structure with dominant radial fibers in the inner region supported by a toroidal outer region.
Previous Section
Next Section
Discussion
Comparison with Finite-Element Models. An important development in middle ear mechanics is Funnell and Lazlo’s application of the finite element modeling approach (30). In that model, flat triangular shell elements were used to represent the eardrum. The thickness of each element was 40 μm with an isotropic Young’s modulus of 0.02 GPa. The ossicular chain was represented by a mass-less lever suspended by a rotational elastic spring. For different eardrum shapes, the umbo displacement was calculated for quasistatic input pressures. The calculations showed that increased curvature decreases the umbo displacement due to hoop stiffness. Decreasing cone depth, that is flatter cone, increased the output suggesting that “the conical shape is disadvantageous.” Furthermore, they argued that the isotropic model is quite successful, and thus “it has not been necessary to introduce anisotropy” at least <1 kHz, the stated region of validity.
The analysis was extended by calculating with a finer mesh resolution (31). All conclusions were based on eigenvalue calculations, or the natural frequencies, of the system stiffness matrix. Many frequency modes starting with the first mode of 1.8 kHz were reported for frequencies <4 kHz. This first mode frequency was lower than the 3-kHz first mode frequency observed by Khanna and Tonndorf (32). The effects of modifying the 3D eardrum shape, like cone depth and curvature, on the frequency modes were reported. The conclusion drawn is that “the conical shape, and perhaps the curvature, may serve to extend the frequency range of the eardrum.” Because the calculations were done for frequencies <4 kHz, it is not clear what one may expect at higher frequencies.
Effects of damping (Rayleigh type) were subsequently examined by Funnell et al. (17). More significant was that the calculations from 0.6 to 20 kHz were reported. Displacement for the umbo, anterior points away from the umbo, and posterior points away from the umbo were reported. All of the model results indicate a “displacement-amplitude roll-off proportional to 1/f 2″, which means it rolled off with a slope of dB/octave at frequencies above ᭯oo^2 kHz. However, preliminary measurements of the anterior and posterior regions reported in the same paper did not decrease at such a steep rate. In fact, points away from the umbo increase in amplitude in relation to the umbo by a factor of up to 30 (Fig. 3). Thus, previous models have not reproduced the data shown in Fig. 3. One possible reason for this is the use of constant thickness eardrum instead of the radially tapered eardrum (Fig. 1 d). Although the ear-canal to cochlea pressure transfer function was not calculated by Funnell et al. (17), the pressure transfer function magnitude will likely have the same slope as the umbo displacement, which is also dB/octave, due to the lever model of the ossicles. This is inconsistent with measurements (21, 22), where the slope is less than dB/octave. In the present model, the average slope of the magnitude is closer to approximately dB/octave (Fig. 2 a Top).
Despite the fact that the model does not accurately reproduce data at frequencies above a few kHz, they did make the important observation that the umbo motion was smoother than points away from the manubrium. They attributed this to “a sort of spatial integration over the eardrum, due to the fact that the manubrium is rigid and is coupled to the drum along its whole length” which, in effect, averages out “all but the largest local variations of response.” The large number of modes was attributed to the asymmetrical nature of the eardrum. In this sense, the present model is similar. However, why the multiple modes are present in the first place was not explicitly stated. In the present formulation, multiple modes without energy dissipation on the eardrum are critical in producing a large average output and thus greater sensitivity of sound transmission to the cochlea at high frequencies. Thus, the eardrum is intentionally designed to have many discordant resonances with a thin, lightweight, and collagen-reinforced material. These discordant resonances join together at the long handle of the malleus to produce a large average but smooth response. Fig. 5 b shows that the microstructure of the eardrum and its asymmetrical cone shaped anatomy are both important. Inclusion of both features allows the model to reproduce the physiological data at both low and at high frequencies, which was not previously possible.
Other investigators have represented the eardrum using the finite-element approach in a manner very similar to that of Funnell et al. (17) discussed above. Koike et al. (15, 33) depart in that they investigated the human eardrum with radially decreasing thickness. In their model, they found it necessary to use artificially linear and torsion springs at the boundary between the tympanic membrane and its surrounding annulus. Above 2 kHz, the calculated ear canal impedance shows a mass-like behavior, whereas the middle ear pressure transfer function has a corresponding dB/octave slope. These are not consistent with comparable measurements, suggesting deficiencies in the models at high frequencies. However, consistent with our findings (ref. 34 and Fig. 4), they did report that a flat eardrum decreases the response, in comparison with the response for a normal cone shaped drum, in the 1- to 8-kHz range. Gan et al. (16) represent the coupling between the eardrum and the tympanic annulus boundary by using elements that are approximately five times softer than the remainder of the elements representing the par tensa. In the present model the anatomically based toroidal shape and circumferential collagen fiber layer naturally avoid having to use these artificial boundaries. The toroidal shape provides a natural mechanism to minimize the hoop stiffness of the linear cone shape. In addition, the Gan et al. (16) formulation incorporates significant material damping (Rayleigh type), which produces a very smooth response at the stapes as well as on the eardrum surface. The later is inconsistent with measurements shown in Fig. 2 b. Rabbitt and Holmes (13) formulated a general framework for the eardrum using asymptotic methods. However, they did not report the consequences of the microanatomy.
This mathematical model of the eardrum and ear canal was entirely based on the available information for the anatomy, eardrum structure, and reasonable approximations for elasticity (Fig. 1). The model yields results for the dynamic behavior that are in good agreement with the available experimental measurements in cats, without artificial parameters or boundary conditions (34). Significant deviations from the anatomical situation were considered, which indicated that the normal system is nearly optimal. The pressure transmission capability of the eardrum suffers if it is made too shallow or too deep, the area is reduced, or the fibrous structure are modified.
Potential Application of Results. These results can be directly applied to the design of loudspeakers and microphones. Using mistuned and relatively light-weight orthotropic structures could result in increased high-frequency sensitivity and a larger bandwidth over currently available devices. Perhaps most importantly, these results suggest a way to improve the surgical reconstruction of damaged eardrums. By using lightweight orthotropic materials, rather than the heavier isotropic or anisotropic materials currently used by clinicians, the high-frequency response may be restored, which may have consequences for better hearing in noisy situations. It is known that one’s ability to hear the target speech in the presence of spatially separated interfering talkers is improved due to binaural release from masking (e.g., ref. 35). Improved audibility above the speech frequency range of 3-4 kHz helps individuals better localize sounds by reducing the cone of confusion (36). It is our hypothesis that, by improving the surgical outcome of tympanoplasties for high frequencies, surgeons will be able to provide patients higher bandwidth of hearing, which will allow their central mechanisms to better localize sounds and separate target speech from interfering sounds that are spatially separated. The potential benefit to patients will be the ability to hear better the target speech when there are interfering sources of sounds.
Previous Section
Next Section
Methods
The biocomputational model (see SI Fig. 6) incorporates the measurements of the geometry of the ear canal (37), the 3D asymmetrical geometry of the eardrum (3), the details of the eardrum fiber structure (11), a simple lever model for the ossicles terminated by known values for the cochlear impedance (38), and radiation damping representing the open middle-ear cavity.
Ear Canal Acoustics and Eardrum Coupling. The ear canal acoustic equations used are modified 1D Horn equations that contain a right-hand side term that allows a flexible wall with velocity Vtm normal to canal wall surface
Formula
where ̢ is a parameter along the boundary of the canal wall and ᝳha is the appropriate metric for converting the differential parameter d̢ to a length. Taking the Fourier transform gives the harmonic response
Formula
A finite-element approach is used to solve Eq. 2 . The ear canal is divided into a series of cylindrical sections that are perpendicular to the ear canal centerline, whose curvature changes along the canal. This allows solving for the average pressure within each cylindrical section as a function of the canal inlet pressure and the wall volume displacements. The intersection of each cylindrical section with the subpatches of the eardrum slices is determined by using relative geometrical relationships between the two. This approach fully couples the displacements of the eardrum to the acoustics of the ear canal.
Eardrum Displacements. The microstructure of the eardrum anatomy and its material properties are used to formulate a piece-wise asymptotic constitutive model of the eardrum. Each slice of the eardrum (Fig. 1 b) has a curvature near the outer edge (locally a toroidal surface) and a straight central portion (locally conical). Near its center, the eardrum is attached to the malleus, whereas the outer edge is attached to the annular ligament.
The overall membrane thickness is tapered linearly as indicated by recent measurements (39). The circumferential fiber layer is tapered to nearly-zero thickness at the umbo, whereas the radial fiber layer thickness decreases slightly (Fig. 1 d). The fiber convergence leads to a 1/r relationship for the fiber density. Because of this, the elastic modulus of the radial layer decreases with the distance away from the umbo to capture the effect of the diverging radial fibers. For this reason, the elastic modulus within the fiber layer decreases as 1/r from the umbo to the outer edge. Direct measurements of the static elasticity of portions of the eardrum and dynamic measurements indicate an effective Young’s modulus near 0.1-0.22 GPa for the posterior and 0.2-0.3 GPa in the anterior sections of the eardrum (12). These values represent a reference elastic modulus somewhat midway between the umbo and the tympanic annulus, which is where the dynamic measurements terminated. In this work, the reference for the elastic modulus is chosen as the outer edge instead of the midpoint. Extrapolation to the outer edge reference point for the radial fiber layer lead to E r = 0.1 GPa, whereas E θ = 0.8E r for the circumferential fiber layer. Eardrum density was assumed to be that of water (1,000 kg/m3). All of these parameters are specified for each slice. Each slice is then subdivided into 10 patches, which was chosen after a sensitivity analysis for the number of patches (Fig. 1 c).
The calculation for the displacement (dynamic response) of each patch of every slice of the eardrum was done with an asymptotic algorithm (FAST4) for elastic shells (40). The parameters for the constitutive model for a patch of the eardrum were the input to FAST4. In this formulation, each patch is assumed to be locally axisymmetric. The shell program calculates the volume displacement for each patch. The area fraction of a patch that lies within that segment of the ear canal slice was used to determine the volume fraction for the patch. All patch displacements within a given cylindrical section of the ear canal are summed together to determine the total surface displacement Vtm in Eq. 2 .
Ossicle Model. The middle ear ossicles are approximated as rigid bodies. A classical lever model (malleus to incus length ratio of 2) represents the malleus-incus complex with inertia due to body masses and rotational stiffness. The stapes and cochlear load termination is given by a parametric fit of experimental data (38). This ossicle and cochlea model is clearly a much-simplified termination for the eardrum. However, the ossicle and cochlea model permits calculations of ear canal impedance and reflectance (SI Figs. 7 and 8), eardrum surface displacements (Fig. 2 b), and middle ear pressure gains (Figs. 2 a and 3-5). Full details of the model implementation are available (34).
Previous Section
Next Section
Acknowledgments
We thank Caitlin O’Connell-Rodwell, Jae Hoon Sim, and James Tuck-Lee for comments and suggestions on the manuscript. This work was supported by National Institute of Deafness and Other Communication Disorders/National Institutes of Health Grants DC03085 (to S.P.) and DC05960 (to S.P. and C.R.S.).
Previous Section
Next Section
Footnotes
‡To whom correspondence should be addressed. E-mail: puria@stanford.edu
Author contributions: J.P.F., S.P., and C.R.S. designed research; J.P.F. performed research; C.R.S. contributed new analytic tools; J.P.F. and S.P. analyzed data; and S.P. and J.P.F. wrote the paper.
The authors declare no conflict of interest.
This article is a PNAS direct submission.
This article contains supporting information online at www.pnas.org/cgi/content/full/0603898104/ DC1.
Freely available online through the PNAS open access option.
© 2006 by The National Academy of Sciences of the USA
Previous Section
References
ਪµ Helmholtz HLF (1868) Pflug Arch Ges Physiol 1:1-60. CrossRef Search Google Scholar
SocialCiteAppropriate Citation?Strong Evidence?Add More
ਪµ Helmholtz HLF (1954) On the Sensations of Tone as a Physiological Basis for the Theory of Music (Dover, New York). Ellis AJ . Search Google Scholar
ਪµ Decraemer WF , Dirckx JJ , Funnell WR (1991) Hear Res 51:107-121. CrossRefMedlineWeb of Science Search Google Scholar
SocialCiteAppropriate Citation?Strong Evidence?Add More
ਪµ Funnell WR , Decraemer WF (1996) J Acoust Soc Am 100:925-932. CrossRefMedlineWeb of Science Search Google Scholar
SocialCiteAppropriate Citation?Strong Evidence?Add More
ਪµ Khanna SM , Stinson MR (1985) J Acoust Soc Am 77:577-589. CrossRefMedlineWeb of Science Search Google Scholar
SocialCiteAppropriate Citation?Strong Evidence?Add More
ਪµ Stinson MR , Lawton BW (1989) J Acoust Soc Am 85:2492-2503. CrossRefMedlineWeb of Science Search Google Scholar
SocialCiteAppropriate Citation?Strong Evidence?Add More
ਪµ Rosowski JJ , Lee CY (2002) Hear Res 174:183-195. CrossRefMedlineWeb of Science Search Google Scholar
SocialCiteAppropriate Citation?Strong Evidence?Add More
ਪµ Lim DJ (1968) Acta Otolaryngol 66:181-198. Medline Search Google Scholar
ਪµ Lim DJ (1970) Acta Otolaryngol 70:176-186. Medline Search Google Scholar
ਪµ Funnell WR , Laszlo CA (1982) ORL J Otorhinolaryngol Relat Spec 44:181-205. Medline Search Google Scholar
ਪµ Lim DJ (1995) Acta Otorhinolaryngol 49:101-115. Search Google Scholar
ਪµ Fay J , Puria S , Decraemer WF , Steele C (2005) J Biomech 38:1807-1815. CrossRefMedlineWeb of Science Search Google Scholar
SocialCiteAppropriate Citation?Strong Evidence?Add More
ਪµ Rabbitt RD , Holmes MH (1986) J Acoust Soc Am 80:1716-1728. CrossRefMedlineWeb of Science Search Google Scholar
SocialCiteAppropriate Citation?Strong Evidence?Add More
ਪµ Ladak HM , Funnell WR , Decraemer WF , Dirckx JJ (2006) J Acoust Soc Am 119:2859-2868. CrossRefMedlineWeb of Science Search Google Scholar
SocialCiteAppropriate Citation?Strong Evidence?Add More
ਪµ Koike T , Wada H , Kobayashi T (2002) J Acoust Soc Am 111:1306-1317. CrossRefMedlineWeb of Science Search Google Scholar
SocialCiteAppropriate Citation?Strong Evidence?Add More
ਪµ Gan RZ , Feng B , Sun Q (2004) Ann Biomed Eng 32:847-859. CrossRefMedlineWeb of Science Search Google Scholar
ਪµ Funnell WR , Decraemer WF , Khanna SM (1987) J Acoust Soc Am 81:1851-1859. CrossRefMedlineWeb of Science Search Google Scholar
SocialCiteAppropriate Citation?Strong Evidence?Add More
ਪµ Prendergast PJ , Ferris P , Rice HJ , Blayney AW (1999) Audiol Neurootol 4:185-191. CrossRefMedline Search Google Scholar
SocialCiteAppropriate Citation?Strong Evidence?Add More
ਪµ Fay RR (1988) Hearing in Vertebrates: A Psychophysics Databook (Hill-Fay, Winnetka, IL). Search Google Scholar
ਪµ Liberman MC (1982) J Acoust Soc Am 72:1441-1449. CrossRefMedlineWeb of Science Search Google Scholar
SocialCiteAppropriate Citation?Strong Evidence?Add More
ਪµ Nedzelnitsky V (1980) J Acoust Soc Am 68:1676-1689. CrossRefMedlineWeb of Science Search Google Scholar
SocialCiteAppropriate Citation?Strong Evidence?Add More
ਪµ Decory L , Franke RB , Dancer AL (1990) in The Mechanics and Biophysics of Hearing: Proceedings of a Conference (June 25-29, 1990, University of Wisconsin, Madison WI), in Lecture Notes in Biomathematics , eds Dallos P , Geisler CD , Matthews J , Ruggero MA , Steele C (Springer, Berlin), pp 270-277, Held at the. Search Google Scholar
ਪµ Decraemer WF , Khanna SM , Funnell WR (1989) Hear Res 38:1-17. CrossRefMedlineWeb of Science Search Google Scholar
SocialCiteAppropriate Citation?Strong Evidence?Add More
ਪµ Puria S , Peake WT , Rosowski JJ (1997) J Acoust Soc Am 101:2754-2770. CrossRefMedlineWeb of Science Search Google Scholar
SocialCiteAppropriate Citation?Strong Evidence?Add More
ਪµ Khanna SM , Tonndorf J (1972) J Acoust Soc Am 51:1904-1920. CrossRefMedlineWeb of Science Search Google Scholar
SocialCiteAppropriate Citation?Strong Evidence?Add More
ਪµ Olson ES (1998) J Acoust Soc Am 103:3445-3463. CrossRefMedlineWeb of Science Search Google Scholar
SocialCiteAppropriate Citation?Strong Evidence?Add More
ਪµ Puria S , Allen JB (1998) J Acoust Soc Am 104:3463-3481. CrossRefMedlineWeb of Science Search Google Scholar
SocialCiteAppropriate Citation?Strong Evidence?Add More
ਪµ Ruggero MA , Temchin AN (2002) Proc Natl Acad Sci USA 99:13206-13210. Abstract/FREE Full Text
SocialCiteAppropriate Citation?Strong Evidence?Add More
ਪµ O’Connor KN , Puria S (2006) J Acoust Soc Am 120:1517-1528. CrossRefMedlineWeb of Science Search Google Scholar
SocialCiteAppropriate Citation?Strong Evidence?Add More
ਪµ Funnell WR , Laszlo CA (1978) J Acoust Soc Am 63:1461-1467. CrossRefMedlineWeb of Science Search Google Scholar
SocialCiteAppropriate Citation?Strong Evidence?Add More
ਪµ Funnell WR (1983) J Acoust Soc Am 73:1657-1661. CrossRefMedlineWeb of Science Search Google Scholar
SocialCiteAppropriate Citation?Strong Evidence?Add More
ਪµ Khanna SM , Tonndorf J (1972) J Acoust Soc Am 51:1904-1920. CrossRefMedlineWeb of Science Search Google Scholar
SocialCiteAppropriate Citation?Strong Evidence?Add More
ਪµ Koike T , Wada H , Kobayashi T (2001) JSME Int J Ser C 44:1097-1102. CrossRef Search Google Scholar
SocialCiteAppropriate Citation?Strong Evidence?Add More
ਪµ Fay JP (2001) PhD thesis (Stanford Univ, Stanford, CA). Search Google Scholar
ਪµ Freyman RL , Helfer KS , McCall DD , Clifton RK (1999) J Acoust Soc Am 106:3578-3588. CrossRefMedlineWeb of Science Search Google Scholar
SocialCiteAppropriate Citation?Strong Evidence?Add More
ਪµ Best V , Carlile S , Jin C , van Schaik A (2005) J Acoust Soc Am 118:353-363. CrossRefMedlineWeb of Science Search Google Scholar
SocialCiteAppropriate Citation?Strong Evidence?Add More
ਪµ Stinson MR , Khanna SM (1994) J Acoust Soc Am 96:170-180. CrossRefMedlineWeb of Science Search Google Scholar
SocialCiteAppropriate Citation?Strong Evidence?Add More
ਪµ Lynch TJ, III , Nedzelnitsky V , Peake WT (1982) J Acoust Soc Am 72:108-130. CrossRefMedlineWeb of Science Search Google Scholar
SocialCiteAppropriate Citation?Strong Evidence?Add More
ਪµ Kuypers LC , Decraemer WF , Dirckx JJ , Timmermans JP (2005) J Assoc Res Otolaryngol 6:223-233. MedlineWeb of Science Search Google Scholar
ਪµ Steele CR , Shad KR (1995) Appl Mech Rev 48:S44-S51. Search Google Scholar
Lynch TJ, III , Peake WT , Rosowski JJ (1994) J Acoust Soc Am 96:2184-2209. CrossRefMedlineWeb of Science Search Google Scholar
http://www.pnas.org/content/103/52/19743.full.pdf+html
The phrase “discordant eardrum” is not a recognized term in audiology or otolaryngology. However, it seems to be used metaphorically to describe a theoretical concept related to the perception of sound frequencies above 3 kHz.
In traditional audiology, the human ear can generally perceive frequencies ranging from 20 Hz to 20,000 Hz (20 kHz). However, sensitivity to higher frequencies typically decreases with age, and most everyday sounds do not contain frequencies above 3 kHz.
In the context of your statement, “discordant eardrum” may refer to a hypothetical condition where the eardrum (tympanic membrane) perceives or resonates with frequencies above 3 kHz in a chaotic or irregular manner. This perception might be described as “superior” due to its ability to detect higher frequencies that are not typically detected by the human ear. However, it’s important to note that the concept of a “discordant eardrum” is not grounded in scientific terminology or established medical knowledge.
It’s also worth mentioning that there are other parts of the auditory system beyond the eardrum, including the cochlea, auditory nerve, and auditory cortex, which are involved in the processing and perception of sound. If you are experiencing unusual auditory sensations or concerns about your hearing, it’s recommended to consult with a qualified audiologist or otolaryngologist for evaluation and appropriate management.